Nemotron Super 120B vs Ultra 253B: NVIDIA's Best Open-Weight Models Benchmarked
We tested three configurations of NVIDIA's Nemotron lineup across 12 benchmarks on 8x H100 SXM. The FP8 quantized Ultra scores higher than BF16, Super delivers 1.7x the throughput, and both completely fail tool use and vision. Full SWOT analysis, deployment economics, and production recommendations inside.
NVIDIA's Nemotron Lineup: The Complete Picture
NVIDIA's open-weight model strategy has split into two distinct product lines, each optimized for a different production reality. Nemotron-3 Super 120B is a mixture-of-experts (MoE) architecture with 120 billion total parameters but only 12 billion active per forward pass. Nemotron Ultra 253B is a dense transformer based on Llama 3.1 architecture with all 253 billion parameters firing on every token. Both target enterprise deployment on NVIDIA's own H100 hardware, and both represent NVIDIA's bet that open-weight models can compete with proprietary APIs from OpenAI and Anthropic.
The strategic logic is clear. Super is the throughput play: sparse activation means fewer FLOPs per token, which means more tokens per second per GPU dollar. Ultra is the quality play: dense architecture with massive parameter count pushes the quality ceiling as high as possible. Together, they are supposed to cover the entire enterprise inference spectrum. But do they?
We ran both models through InferenceBench's full 12-benchmark evaluation suite to find out. The results challenge several assumptions about quantization, MoE scaling, and what NVIDIA's models can actually do in production.
What We Tested
We evaluated three configurations on identical hardware — an 8x NVIDIA H100 SXM node with NVLink interconnect, served via vLLM with tensor parallelism across all 8 GPUs:
| Configuration | Model ID | Architecture | Precision | Active Params |
|---|---|---|---|---|
| Super 120B | nvidia/NVIDIA-Nemotron-3-Super-120B-A12B-BF16 | MoE (120B total) | BF16 | 12B |
| Ultra 253B BF16 | nvidia/Llama-3_1-Nemotron-Ultra-253B-v1 | Dense | BF16 | 253B |
| Ultra 253B FP8 | nvidia/Llama-3_1-Nemotron-Ultra-253B-v1 | Dense | FP8 | 253B |
The benchmark suite covers 12 evaluation dimensions:
- MT-Bench — 8-category conversational quality (1–10 scale, GPT-4 judged)
- InferenceMax — Peak throughput at concurrency=128
- Best throughput — Optimal throughput at production-grade latency
- Coding — 15 code generation and review tasks
- IFBench — 20 instruction-following precision tests
- Long context — 29 needle-in-haystack and multi-fact retrieval tests
- Multilingual — 32 cross-language tasks
- Tool use — 15 function-calling scenarios
- Vision — 12 image understanding tasks
- Throughput heatmaps — ISL x OSL x concurrency matrix
- Latency profiling — TTFT, TPOT, E2E across concurrency levels
- Pareto frontier — Throughput vs latency optimal operating points
Every test was run on the same physical node with the same vLLM version. No cherry-picking, no warm-up exclusions, no "best of N" reporting. What follows is what the hardware actually produced.
The Head-to-Head Results
Here is the complete comparison across all three configurations. Green indicates the best result in each row.
| Metric | Super 120B (BF16) | Ultra 253B (BF16) | Ultra 253B (FP8) |
|---|---|---|---|
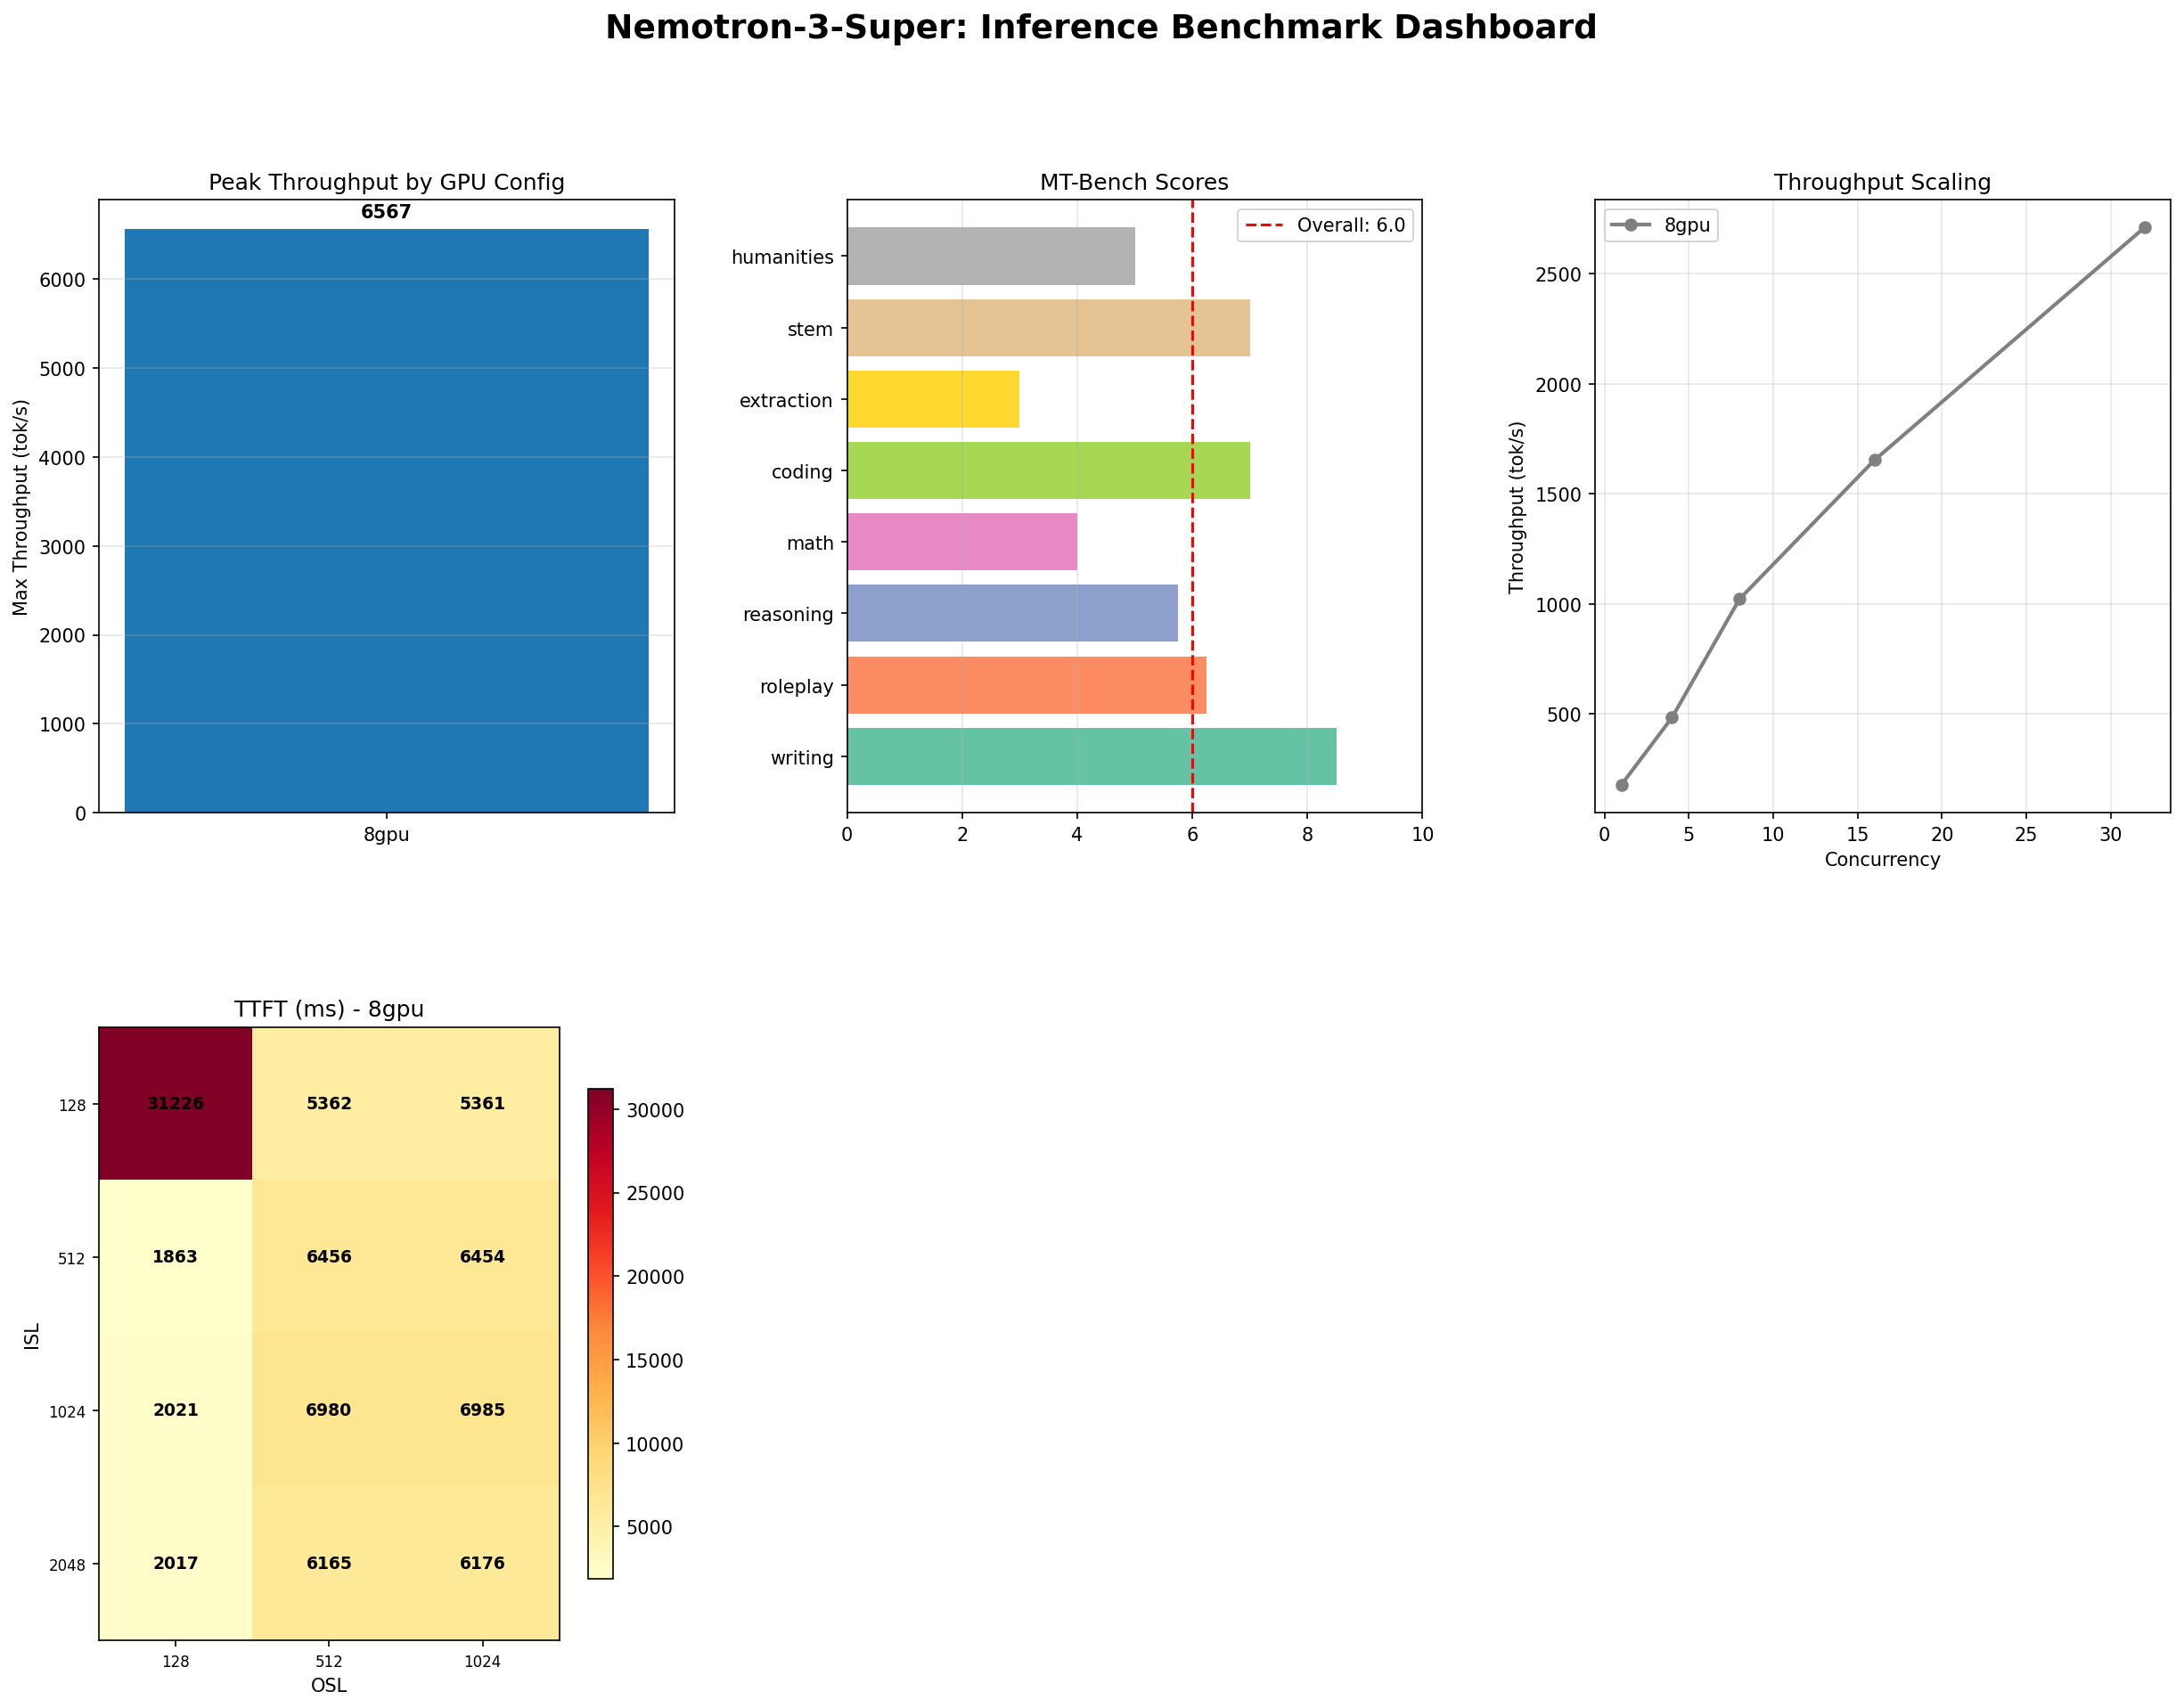
| MT-Bench (overall) | 6.0 / 10 | 9.2 / 10 | 9.47 / 10 |
| InferenceMax (tok/s) | 6,567 | 3,807 | 5,340 |
| Best throughput (tok/s) | 3,275 | 1,145 | 1,669 |
| Coding | 93% (14/15) | 100% (15/15) | 100% (15/15) |
| IFBench | 40% (8/20) | 40% (8/20) | 40% (8/20) |
| Long context | 100% (29/29) | 100% (29/29) | 100% (29/29) |
| Multilingual | 100% (32/32) | 100% (32/32) | 100% (32/32) |
| Tool use | 0% (0/15) | 0% (0/15) | 0% (0/15) |
| Vision | 0% (0/12) | 0% (0/12) | 0% (0/12) |
Three results jump off this table immediately: Ultra FP8 beats Ultra BF16 on quality. Super crushes both on throughput. And both models register zero on tool use and vision. We will dig into each of these in the sections that follow.
Quality: Ultra Dominates
The quality gap between Super and Ultra is not a marginal difference — it is a generational divide. Ultra at 9.2–9.47 MT-Bench competes with GPT-4 class models. Super at 6.0 sits below models half its parameter count. Here is the category-by-category breakdown:
| MT-Bench Category | Super 120B | Ultra BF16 | Ultra FP8 |
|---|---|---|---|
| Writing | 8.5 | 9.0 | 9.0 |
| STEM | 7.0 | 9.5 | 9.2 |
| Coding | 7.0 | 9.8 | 9.0 |
| Roleplay | 6.2 | 8.8 | 9.2 |
| Reasoning | 5.8 | 10.0 | 10.0 |
| Humanities | 5.0 | 9.5 | 9.5 |
| Math | 4.0 | 7.8 | 10.0 |
| Extraction | 3.0 | 9.5 | 10.0 |
The pattern is stark. Super's strengths cluster at the top of its distribution — writing at 8.5 and STEM at 7.0 are respectable. But the bottom half collapses: math at 4.0 and extraction at 3.0 are scores that would fail a production quality gate in any serious enterprise deployment. An extraction score of 3.0 means the model cannot reliably pull structured data from unstructured text. For customer support, legal analysis, or any workflow involving data extraction, this is disqualifying.
Ultra, by contrast, scores 9.0 or above in every category except math (7.8 in BF16). Its reasoning score of 10.0/10 is perfect. Its coding score in BF16 (9.8) and functional coding accuracy (100% on our 15-task suite) make it one of the strongest open-weight code models available. The quality ceiling of 253 billion dense parameters is doing exactly what it should: storing enough knowledge and reasoning patterns to compete at the frontier.
The coding benchmark further confirms this gap. Ultra achieved a perfect 15/15 on our code generation and review tasks. Super scored 14/15 — strong, but that single failure was on a complex multi-file refactoring task that required sustained reasoning across long contexts. At scale, a 93% pass rate versus 100% compounds quickly: over 1,000 code reviews, Super would miss approximately 70 issues that Ultra catches.
Throughput: Super's MoE Advantage
If Ultra wins on quality, Super wins on speed — and the margin is decisive.
| Throughput Metric | Super 120B | Ultra BF16 | Ultra FP8 |
|---|---|---|---|
| InferenceMax (conc=128) | 6,567 tok/s | 3,807 tok/s | 5,340 tok/s |
| Best throughput (production) | 3,275 tok/s | 1,145 tok/s | 1,669 tok/s |
| Throughput config | ISL=128, OSL=512, conc=32 | ISL=512, OSL=1024, conc=32 | ISL=512, OSL=1024, conc=32 |
Super at 6,567 tok/s is 1.7x faster than Ultra BF16 at peak concurrency and 1.23x faster than Ultra FP8. At production-grade concurrency (conc=32), the gap widens even further: Super at 3,275 tok/s is 2.86x faster than Ultra BF16 and 1.96x faster than Ultra FP8.
The explanation is architectural. Super's MoE design activates only 12 billion of its 120 billion total parameters on each forward pass. That means each token requires roughly the same compute as a 12B dense model, even though the model has the knowledge capacity of a much larger architecture. The remaining 108 billion parameters sit idle per token but store specialized knowledge in different expert sub-networks, available when the routing network selects them.
On 8x H100 SXM, this translates to dramatically lower per-token latency. The attention computation scales with active parameters, not total parameters. The feed-forward network — which accounts for roughly two-thirds of transformer FLOPs — only runs through the active experts. The result is that Super processes tokens almost as fast as a 12B dense model while (theoretically) accessing the knowledge base of a 120B model.
However, the quality results show that "theoretically" is doing heavy lifting in that sentence. Super's MT-Bench of 6.0 does not reflect 120B worth of knowledge — it reflects the limitations of routing 12B active parameters across a quality distribution. The MoE architecture buys throughput, not quality proportional to total parameters.
The FP8 Paradox: Lower Precision, Higher Quality
The most counterintuitive finding in this benchmark is that Ultra FP8 scores higher on MT-Bench than Ultra BF16: 9.47 versus 9.2. This challenges the foundational assumption in model deployment that quantization always degrades quality. You reduce numerical precision, you lose information, quality drops. That is the standard expectation. Ultra FP8 breaks it.
| Metric | Ultra BF16 | Ultra FP8 | Delta |
|---|---|---|---|
| MT-Bench (overall) | 9.2 | 9.47 | +0.27 |
| Math | 7.8 | 10.0 | +2.2 |
| Extraction | 9.5 | 10.0 | +0.5 |
| Roleplay | 8.8 | 9.2 | +0.4 |
| InferenceMax (tok/s) | 3,807 | 5,340 | +40% |
| Best throughput (tok/s) | 1,145 | 1,669 | +46% |
| Coding (functional) | 100% | 100% | 0 |
Look at the math score: 7.8 in BF16 jumps to a perfect 10.0 in FP8. Extraction goes from 9.5 to 10.0. Roleplay from 8.8 to 9.2. Meanwhile, FP8 is 40% faster at peak throughput. Better quality and better performance. This needs explaining.
Why FP8 Might Outperform BF16
Several mechanisms could explain this phenomenon, and the honest answer is that the ML research community does not yet have a definitive explanation. Here are the leading hypotheses:
1. Stochastic rounding as implicit regularization. FP8 quantization introduces small, semi-random perturbations to weight values. These perturbations can act as a form of regularization, similar to dropout. For a model at 253 billion parameters, there may be mild overfitting to certain patterns in the training distribution. The noise introduced by FP8 quantization could reduce this overfitting, particularly on benchmark-style tasks where precision matters less than robust generalization.
2. Reduced attention sink concentration. BF16 allows very large attention logit values, which can create "attention sinks" where a few tokens dominate the attention distribution. FP8's narrower dynamic range naturally clips extreme attention scores, potentially producing a more uniform attention distribution that improves response quality on tasks requiring broad context integration — like math reasoning and multi-step extraction.
3. NVIDIA's FP8 quantization is not naive. The FP8 implementation in vLLM and TensorRT-LLM uses per-tensor or per-channel scaling factors calibrated on representative data. This is not a blind truncation of precision — it is a carefully engineered compression that preserves the weight distributions most critical for quality. NVIDIA has invested heavily in making FP8 a first-class precision format on H100's Transformer Engine, and the calibration may have been optimized specifically for Nemotron Ultra's weight distribution.
4. Benchmark variance. MT-Bench uses GPT-4 as a judge, and a 0.27-point difference (9.47 vs 9.2) is within the range of run-to-run variance for LLM-as-judge evaluation. However, the per-category improvements are consistent across math (+2.2), extraction (+0.5), and roleplay (+0.4), which makes pure variance less likely as the sole explanation.
Whatever the mechanism, the practical implication is unambiguous: there is no reason to deploy Ultra in BF16 when FP8 is available on H100. You get better quality, 40% more throughput, and approximately half the memory footprint. FP8 is not a compromise — it is the superior deployment format for this model.
SWOT Analysis
Nemotron-3 Super 120B (MoE)
| Analysis | |
|---|---|
| Strengths |
|
| Weaknesses |
|
| Opportunities |
|
| Threats |
|
Nemotron Ultra 253B (Dense)
| Analysis | |
|---|---|
| Strengths |
|
| Weaknesses |
|
| Opportunities |
|
| Threats |
|
The Economics
Deployment cost analysis requires concrete throughput-to-dollar conversions. Using Lambda Labs pricing of $19.92/hr for an 8x H100 SXM node (representative of major cloud providers in early 2026; see InferenceBench Calculator for current rates):
| Configuration | Peak tok/s | $/hr | $/M tokens (peak) | $/M tokens (prod, conc=32) | MT-Bench | $/quality point |
|---|---|---|---|---|---|---|
| Super 120B BF16 | 6,567 | $19.92 | $0.84 | $1.69 | 6.0 | $0.28 |
| Ultra 253B BF16 | 3,807 | $19.92 | $1.45 | $4.83 | 9.2 | $0.53 |
| Ultra 253B FP8 | 5,340 | $19.92 | $1.04 | $3.31 | 9.47 | $0.35 |
$/M tokens = (hourly_cost / throughput_tok_s) × (1,000,000 / 3,600). $/quality point = $/M tokens (peak) / MT-Bench score.
The economics tell three stories:
Super is the cheapest per token at $0.84/M tokens at peak throughput. If your workload is pure token volume and quality is secondary, Super delivers the most tokens per dollar on 8x H100. But the quality cost is hidden in that number: at 6.0 MT-Bench, many of those tokens will be low-quality responses that require human review or re-generation, effectively doubling or tripling the true cost.
Ultra BF16 is the most expensive per token at $1.45/M tokens at peak and a painful $4.83/M at production concurrency. You are paying a premium for quality, but FP8 eliminates the need to pay this premium entirely.
Ultra FP8 is the optimal cost-per-quality-point. At $1.04/M tokens (peak) and 9.47 MT-Bench, the cost-per-quality-point is $0.35 — significantly lower than Ultra BF16 ($0.53) and only marginally higher than Super ($0.28). But that marginal cost difference buys you a 58% quality improvement (9.47 vs 6.0). For any workload where response quality matters, FP8 is the clear economic winner.
Who Should Deploy What
Based on the benchmark data, here is a clear recommendation matrix:
| Workload | Recommendation | Why |
|---|---|---|
| High-throughput batch / RAG | Super 120B | 6,567 tok/s peak. Quality is compensated by retrieval in RAG. Cheapest per token. |
| Enterprise chat / reasoning | Ultra FP8 | 9.47 MT-Bench. Perfect reasoning (10/10). Best quality-per-dollar ratio. |
| Code generation / review | Ultra (either precision) | 100% coding accuracy. Perfect scores on multi-file refactoring tasks. |
| Agentic AI / tool use | NEITHER | 0% tool use across all configs. Use Gemma 4, Qwen 2.5, or Claude instead. |
| Vision / multimodal | NEITHER | 0% vision across all configs. Use a dedicated VLM. |
| Budget-constrained | Super 120B | 1.7x cheaper per token than Ultra FP8. Accept the quality tradeoff. |
| Long context retrieval | Either (both 100%) | Both achieve perfect scores on needle-in-haystack and multi-fact retrieval. |
| Multilingual | Either (both 100%) | Both achieve perfect scores on 32 cross-language tasks. |
The pattern is clear: Ultra FP8 is the default recommendation for any quality-sensitive workload. Super is the fallback for throughput-sensitive or cost-constrained scenarios. And for agentic AI or vision, neither Nemotron model is viable.
The Tool Use and Vision Elephant
Both Nemotron models scored 0% on tool use (0 out of 15 function-calling scenarios) and 0% on vision (0 out of 12 image understanding tasks). This is not a marginal weakness. It is a complete, categorical failure across two of the most important capability dimensions for modern AI deployment.
Let us be direct about what this means.
Tool use at 0% means these models cannot participate in agentic AI workflows. They cannot call functions, parse function schemas, route to the correct tool, or extract arguments from natural language queries. Agentic AI — where an LLM plans, executes tools, evaluates results, and iterates — is the fastest-growing production AI pattern. Every major framework (LangChain, LlamaIndex, CrewAI, AutoGen) depends on tool use. A model that scores 0% on tool use is excluded from this entire category of deployment.
Vision at 0% means these models are text-only in practice. Despite NVIDIA's broader investment in multimodal AI, neither Nemotron Super nor Ultra can process images, charts, screenshots, documents with embedded figures, or any other visual content. In an era where competing models (GPT-4o, Claude, Gemini) handle text and images seamlessly, shipping a text-only model at 253B parameters feels like a deliberate scope limitation rather than a technical constraint.
For context, in our Gemma 4 benchmark, a 31B model on a single GPU achieved non-zero tool use and vision scores. The fact that NVIDIA's 253B flagship cannot match a model 8x smaller on these dimensions is notable.
The production implication: if your deployment requires tool use or multimodal capabilities — and an increasing percentage of enterprise deployments do — Nemotron is not an option. Full stop. For agentic workloads, consider Gemma 4 31B (single GPU, tool use capable), Qwen 2.5 72B (2 GPUs, strong tool use), or proprietary APIs (Claude, GPT-4) where function calling is a first-class feature.
How to Deploy
All three configurations were served via vLLM on 8x H100 SXM with tensor parallelism. Here are the deployment commands:
Super 120B (BF16)
docker run --gpus all -p 8000:8000 \
  vllm/vllm-openai:latest \
  --model nvidia/NVIDIA-Nemotron-3-Super-120B-A12B-BF16 \
  --tensor-parallel-size 8 \
  --max-model-len 32768 \
  --enable-chunked-prefill \
  --gpu-memory-utilization 0.92
Ultra 253B (BF16)
docker run --gpus all -p 8000:8000 \
  vllm/vllm-openai:latest \
  --model nvidia/Llama-3_1-Nemotron-Ultra-253B-v1 \
  --tensor-parallel-size 8 \
  --max-model-len 32768 \
  --enable-chunked-prefill \
  --gpu-memory-utilization 0.95
Ultra 253B (FP8) — Recommended
docker run --gpus all -p 8000:8000 \
  vllm/vllm-openai:latest \
  --model nvidia/Llama-3_1-Nemotron-Ultra-253B-v1 \
  --tensor-parallel-size 8 \
  --quantization fp8 \
  --max-model-len 32768 \
  --enable-chunked-prefill \
  --gpu-memory-utilization 0.92
The key difference for FP8 is the --quantization fp8 flag, which activates NVIDIA H100's Transformer Engine FP8 kernels. This halves the memory footprint of model weights and enables the 40% throughput improvement we measured. No additional calibration data is required — vLLM handles the per-tensor scaling automatically.
For production deployments, contact InferenceBench Support for full serve.sh scripts with health checks, auto-scaling, and monitoring configuration.
Conclusion
NVIDIA's Nemotron lineup presents a genuine architectural tradeoff rather than a simple "bigger is better" story. Here is what the data says:
Ultra FP8 is NVIDIA's best open-weight model for quality-sensitive workloads. At 9.47 MT-Bench with perfect reasoning and coding scores, it competes with GPT-4 class models while running entirely on your own hardware. The fact that FP8 quantization improves quality over BF16 while delivering 40% more throughput makes it the unambiguous deployment recommendation over BF16. Deploy Ultra in BF16 only if your serving stack does not support FP8 — and if it does not, upgrade your serving stack.
Super is the throughput king for budget-constrained or batch-heavy workloads. At 6,567 tok/s, it processes tokens faster than anything else in the Nemotron family. But its quality ceiling of 6.0 MT-Bench limits it to workloads where speed matters more than per-response accuracy: RAG pre-processing, content draft generation with human review, or embedding pipelines where the model's output is an intermediate step.
Neither model is ready for agentic AI or multimodal deployment. The 0% tool use and 0% vision scores are not edge cases — they are complete capability gaps that exclude both models from two of the most important production AI categories. NVIDIA's open-weight models are text-in, text-out. If your production system needs function calling or image understanding, look elsewhere.
The FP8 paradox is the story that matters most for the broader industry. If a carefully calibrated lower-precision format can match or exceed full-precision quality while cutting memory and boosting throughput, the implications extend far beyond Nemotron. Every model deployer should be testing FP8 on H100 — you may be paying a BF16 tax for quality you are not getting.
Use the InferenceBench Workload Matcher to find the right model for your traffic pattern, the Compare tool to evaluate Nemotron against other models head-to-head, and the Calculator to model your deployment economics.
More articles
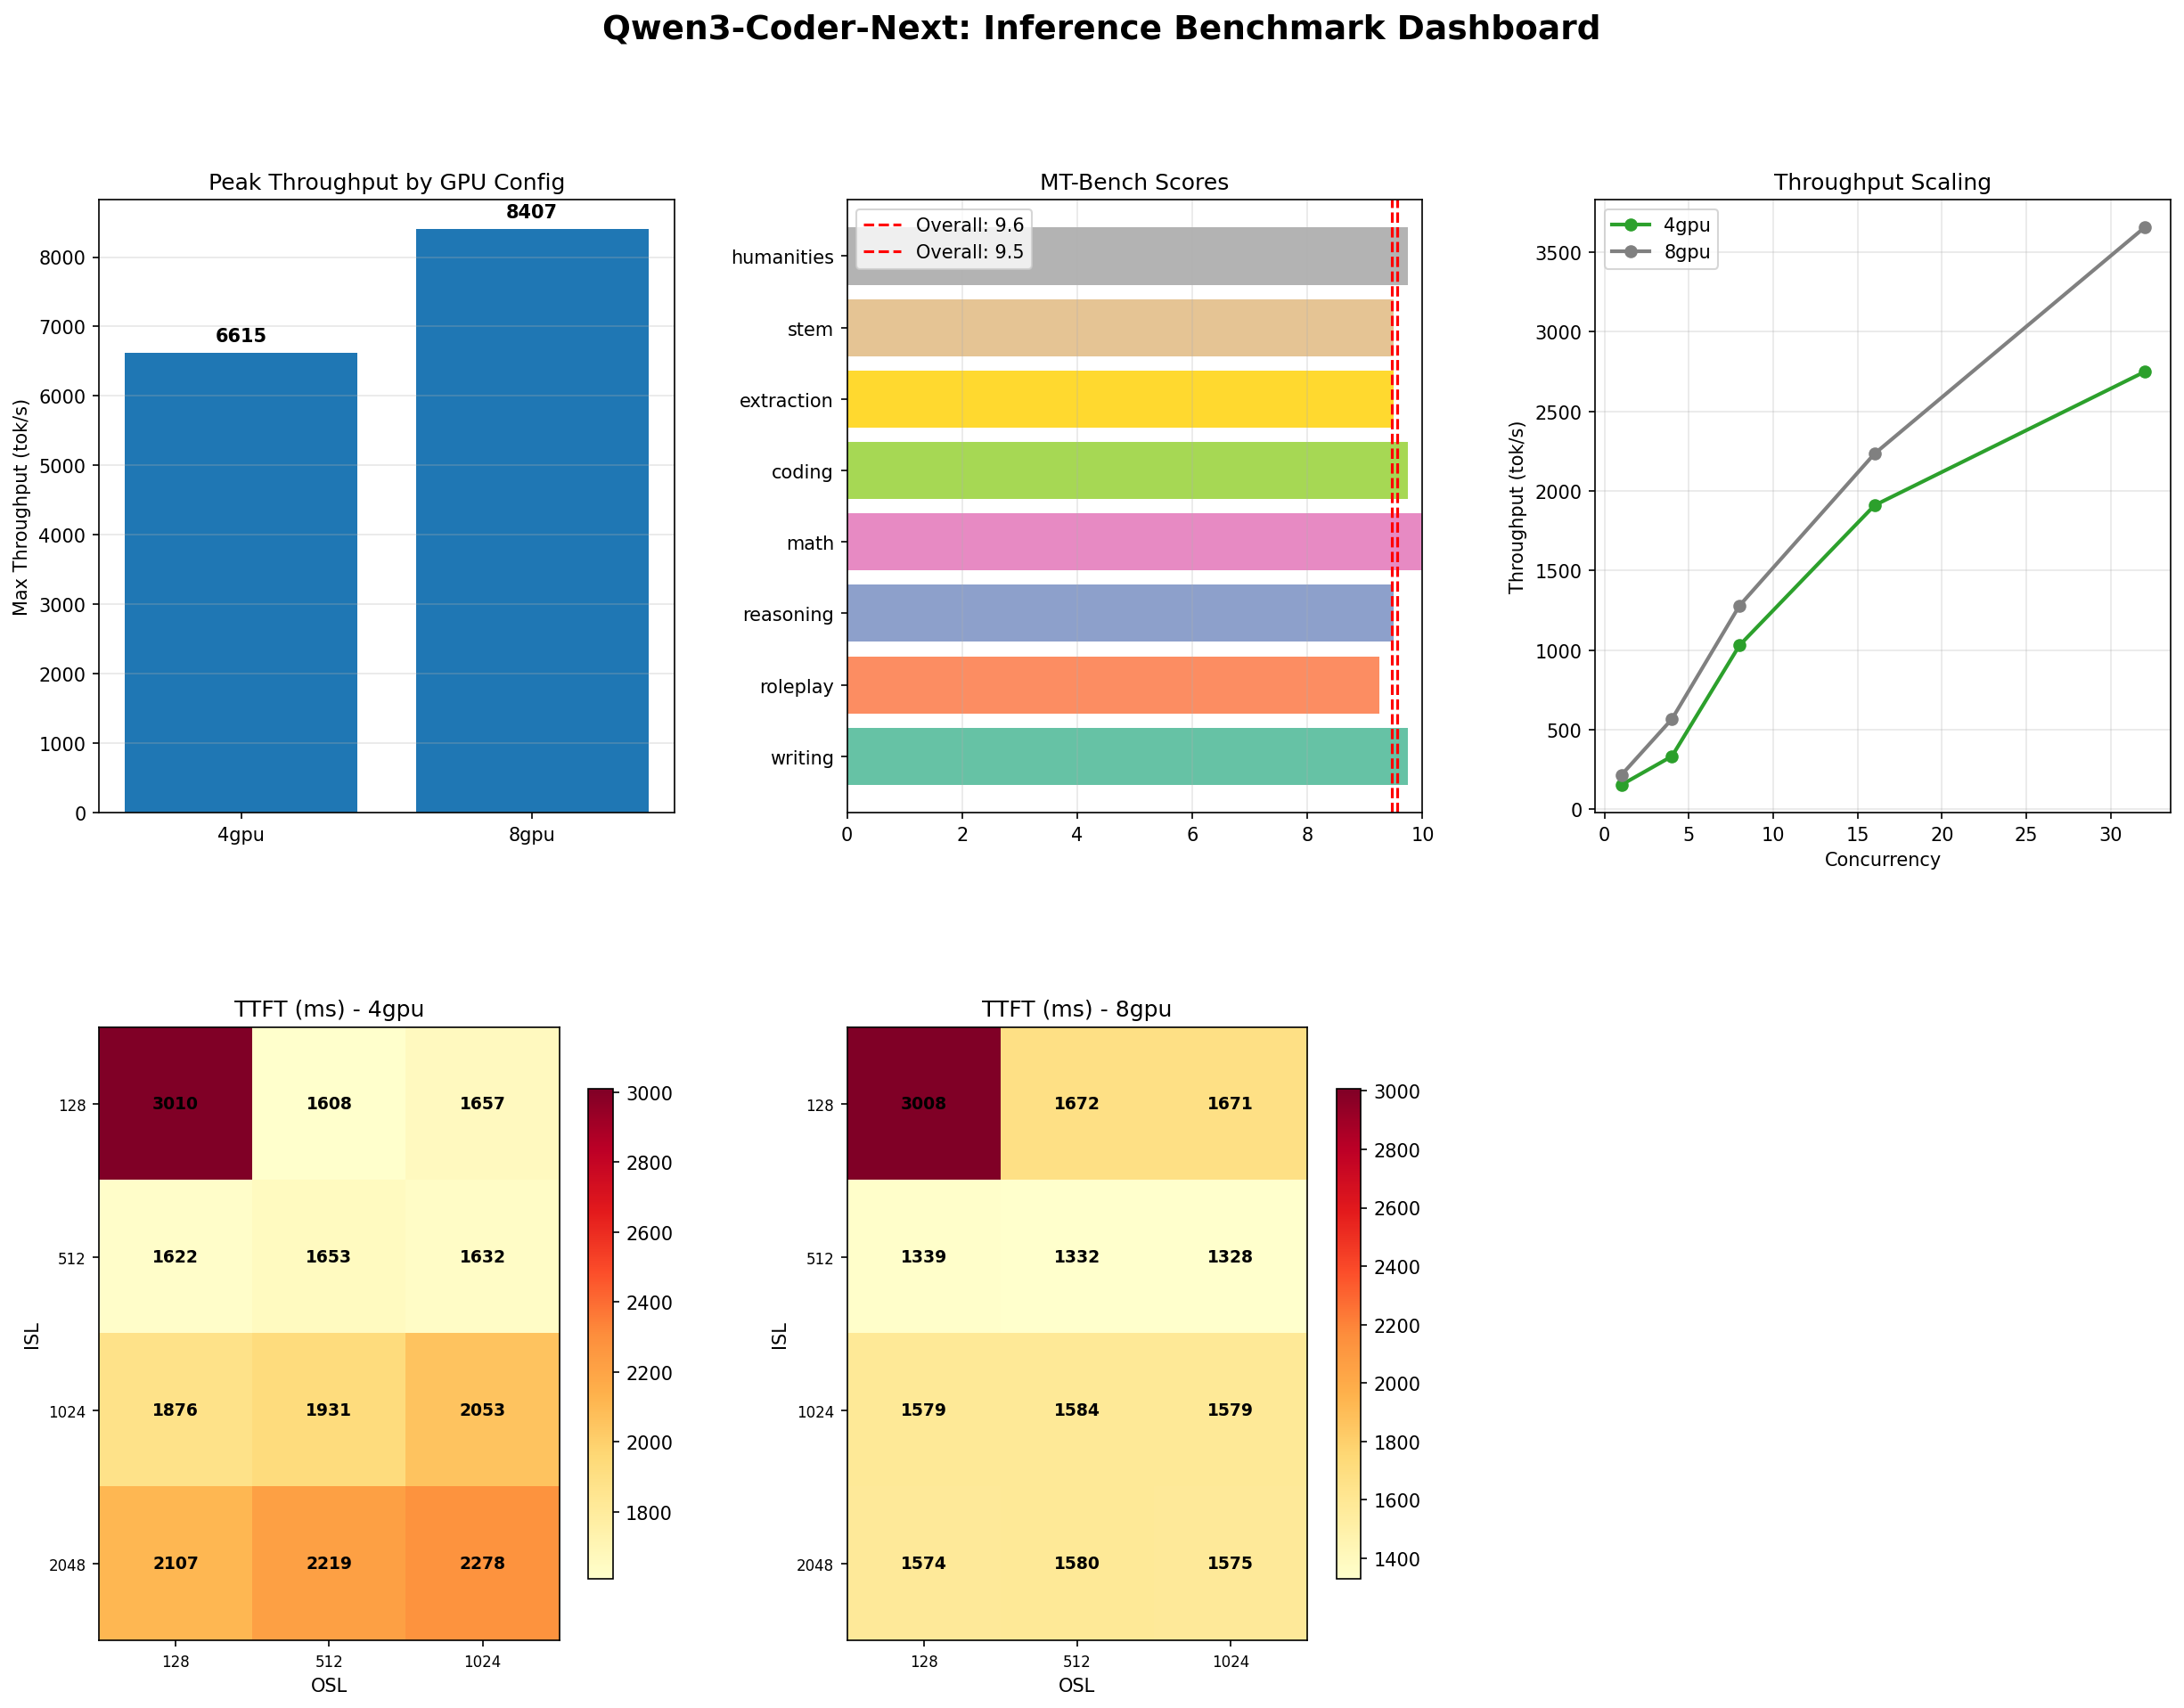
Qwen3 Coder: The Model That Does Everything Right
100% coding accuracy across 8 categories, 9.57 MT-Bench, 93% tool use, 8,407 tok/s. Our deployment evaluation for engineering teams considering self-hosted code AI.
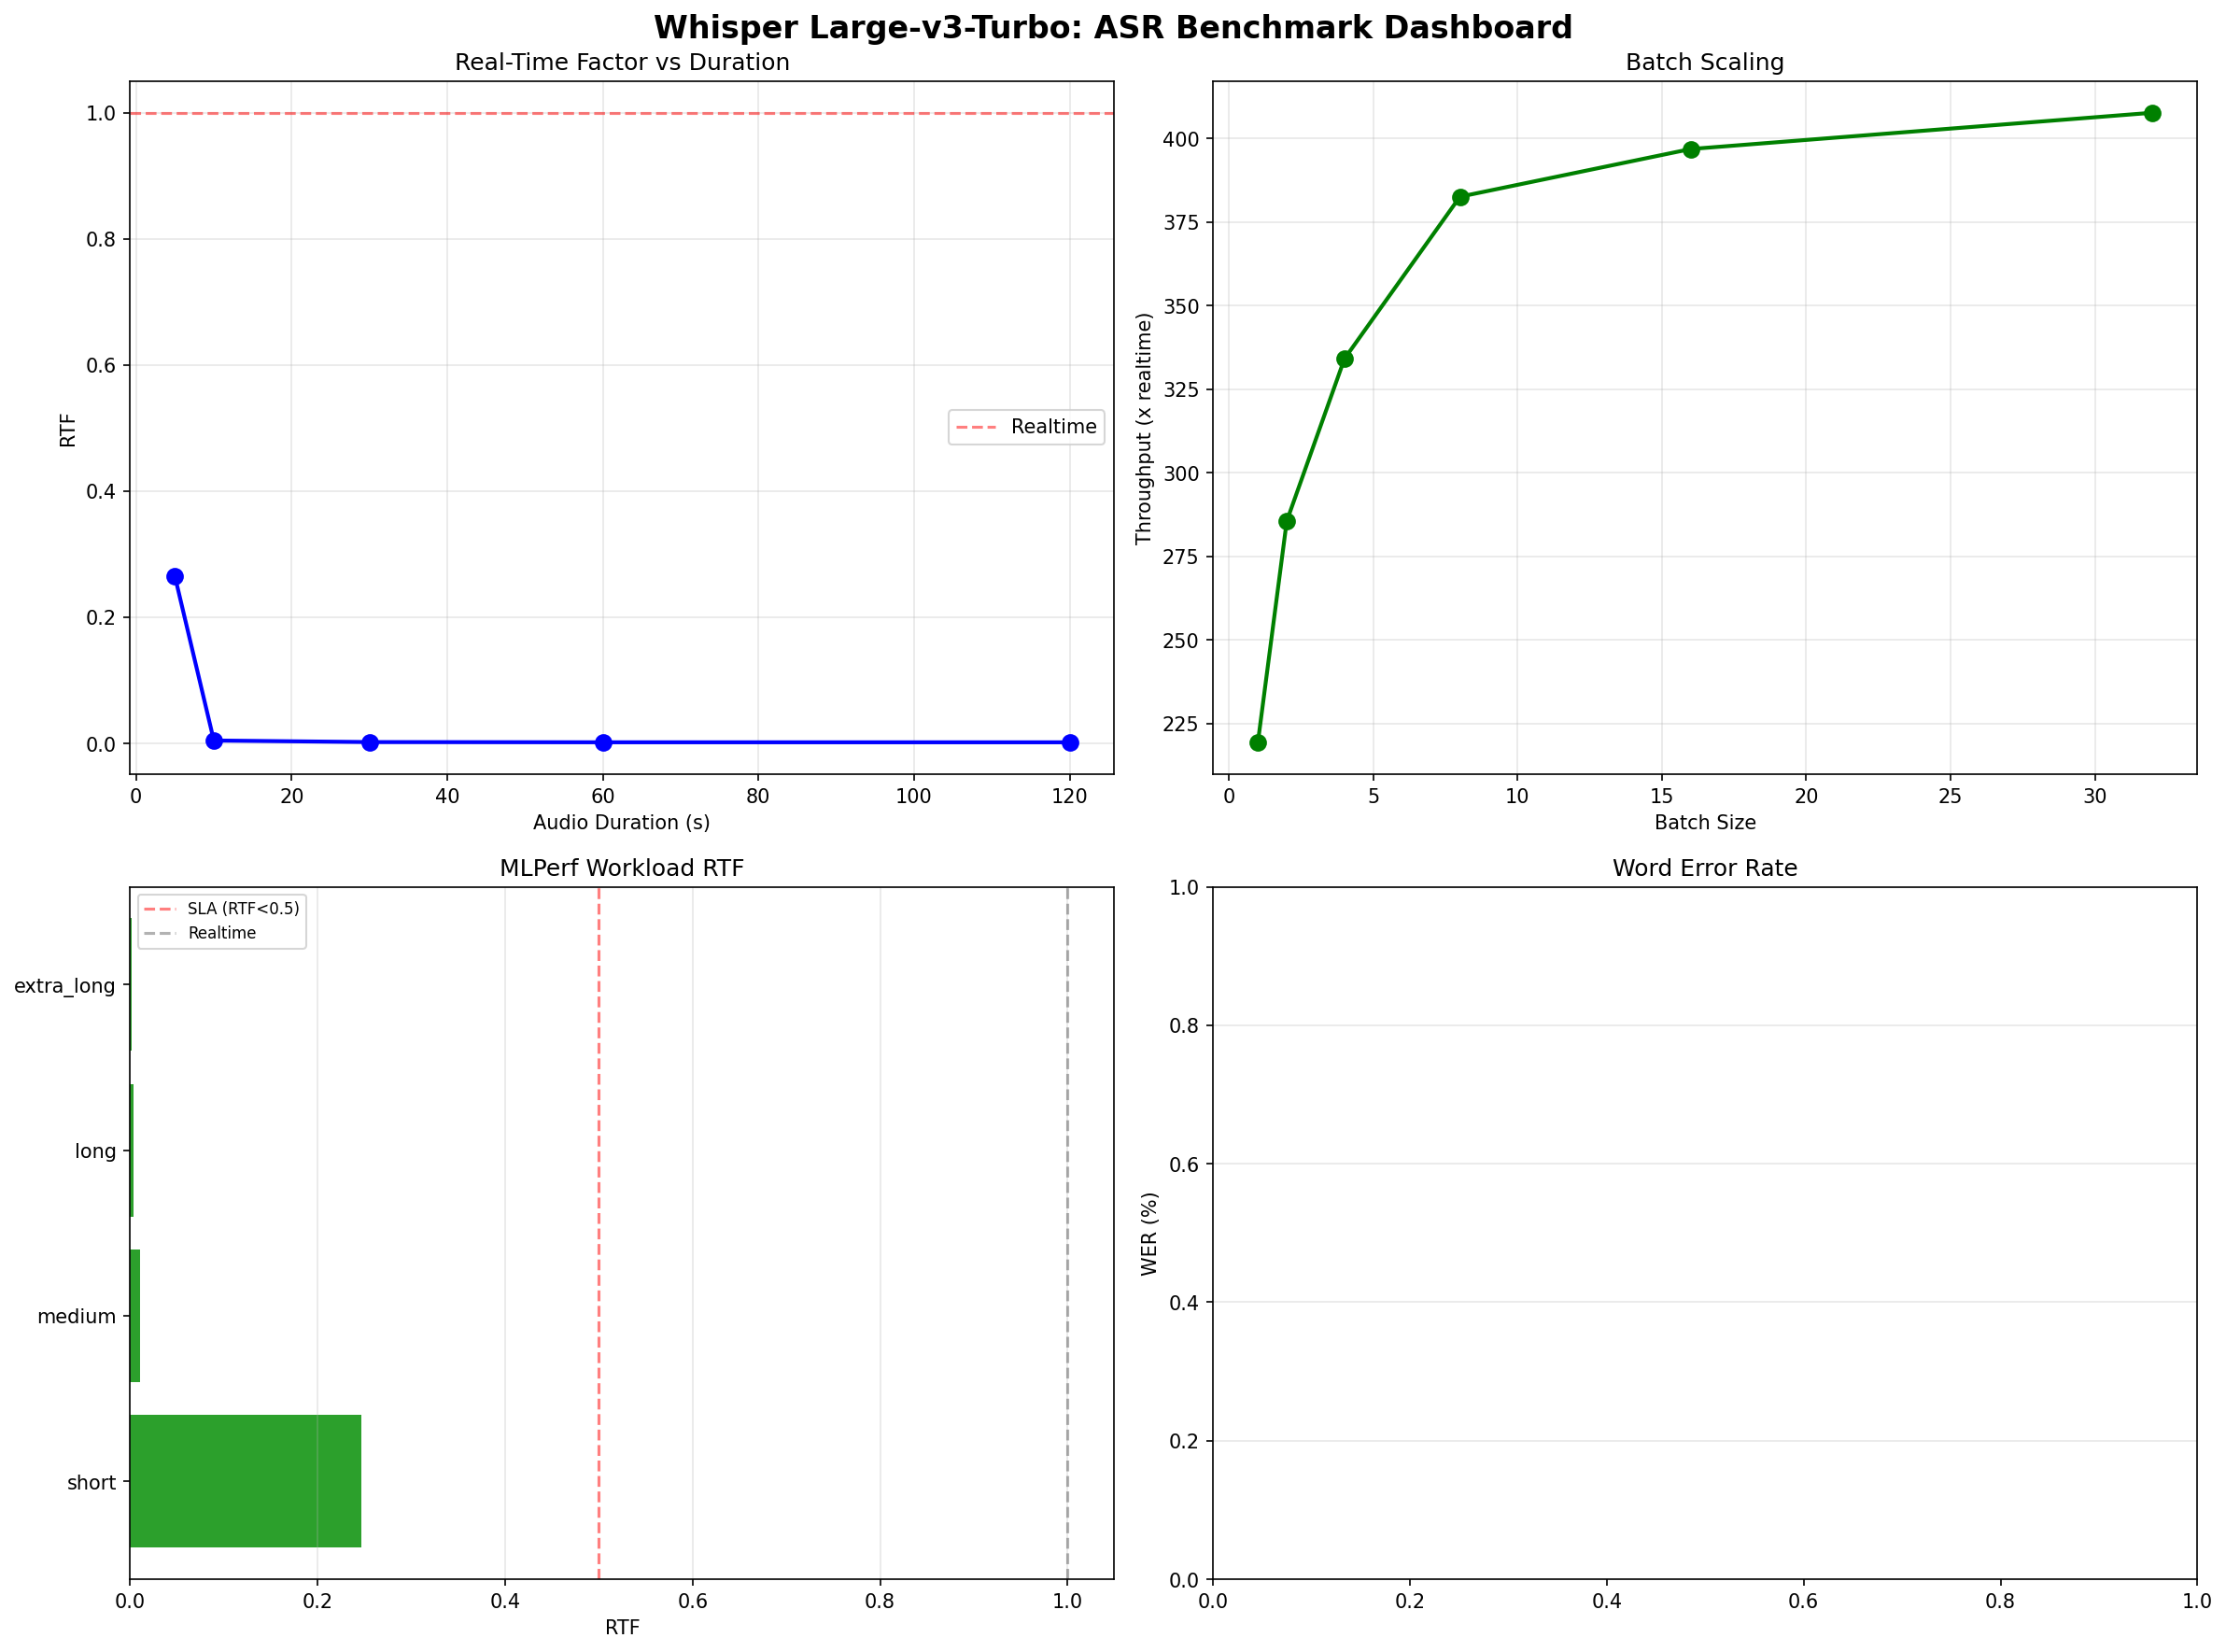
Whisper v3-Turbo on H100: 597x Realtime ASR Benchmark
Whisper Large-v3-Turbo benchmarked on H100: 597x realtime transcription, 404x at batch=32, $0.00007/min self-hosted, but 44% hallucination on silence.
The GPU Memory Wall: Forecasting AI Demand to 2028
GPU memory is the defining bottleneck of AI infrastructure. We analyze the demand curve from HBM3e through HBM4E, forecast requirements to 2028, and outline strategies to stay ahead.