Gemma 4 31B on H100: The Complete Inference Benchmark
We ran 4 inference tests across 1, 2, 4, and 8 x H100 GPUs on Google DeepMind's latest open-weight model, collecting 240 throughput data points, concurrency stress tests, MT-Bench quality scores, and Pareto frontier analysis. Here are the results.
Introduction: What Is Gemma 4?
In early 2025, Google DeepMind released Gemma 4, the latest generation of their open-weight model family. The 31B-it variant is a 31-billion parameter dense transformer — not a mixture-of-experts (MoE) model, which means every token activates every parameter on every forward pass. This matters for benchmarking because it sets a clean baseline: no routing variance, no expert imbalance, no sparse activation noise. What you measure is what you get.
Gemma 4 31B ships with an 8,192-token context window, supports bfloat16 natively, and is designed for instruction-following tasks out of the box. Google DeepMind positioned it as a strong generalist that competes with models two to three times its size, and the open-weight license means anyone can deploy it on their own hardware without API dependencies or per-token fees.
We wanted to answer the questions that matter for production deployment: How fast is it? How does it scale across GPUs? Where are the latency cliffs? What does it actually cost per million tokens? And critically, is the quality good enough to justify the infrastructure? We ran four comprehensive test suites across 1, 2, 4, and 8 NVIDIA H100 SXM GPUs and recorded everything.
This is Part 1 of a two-part series. This post covers Gemma 4 31B's performance in isolation. Part 2 will compare it head-to-head against MoE competitors at similar capability levels, where the dense-vs-sparse architecture tradeoff becomes the central question.
Why This Benchmark Matters
Most model benchmarks test one thing: quality. They run MMLU, HumanEval, or GSM8K and publish a leaderboard position. That tells you whether the model is smart. It does not tell you whether you can afford to run it, how many users it can serve simultaneously, whether latency stays acceptable under load, or how much GPU you actually need.
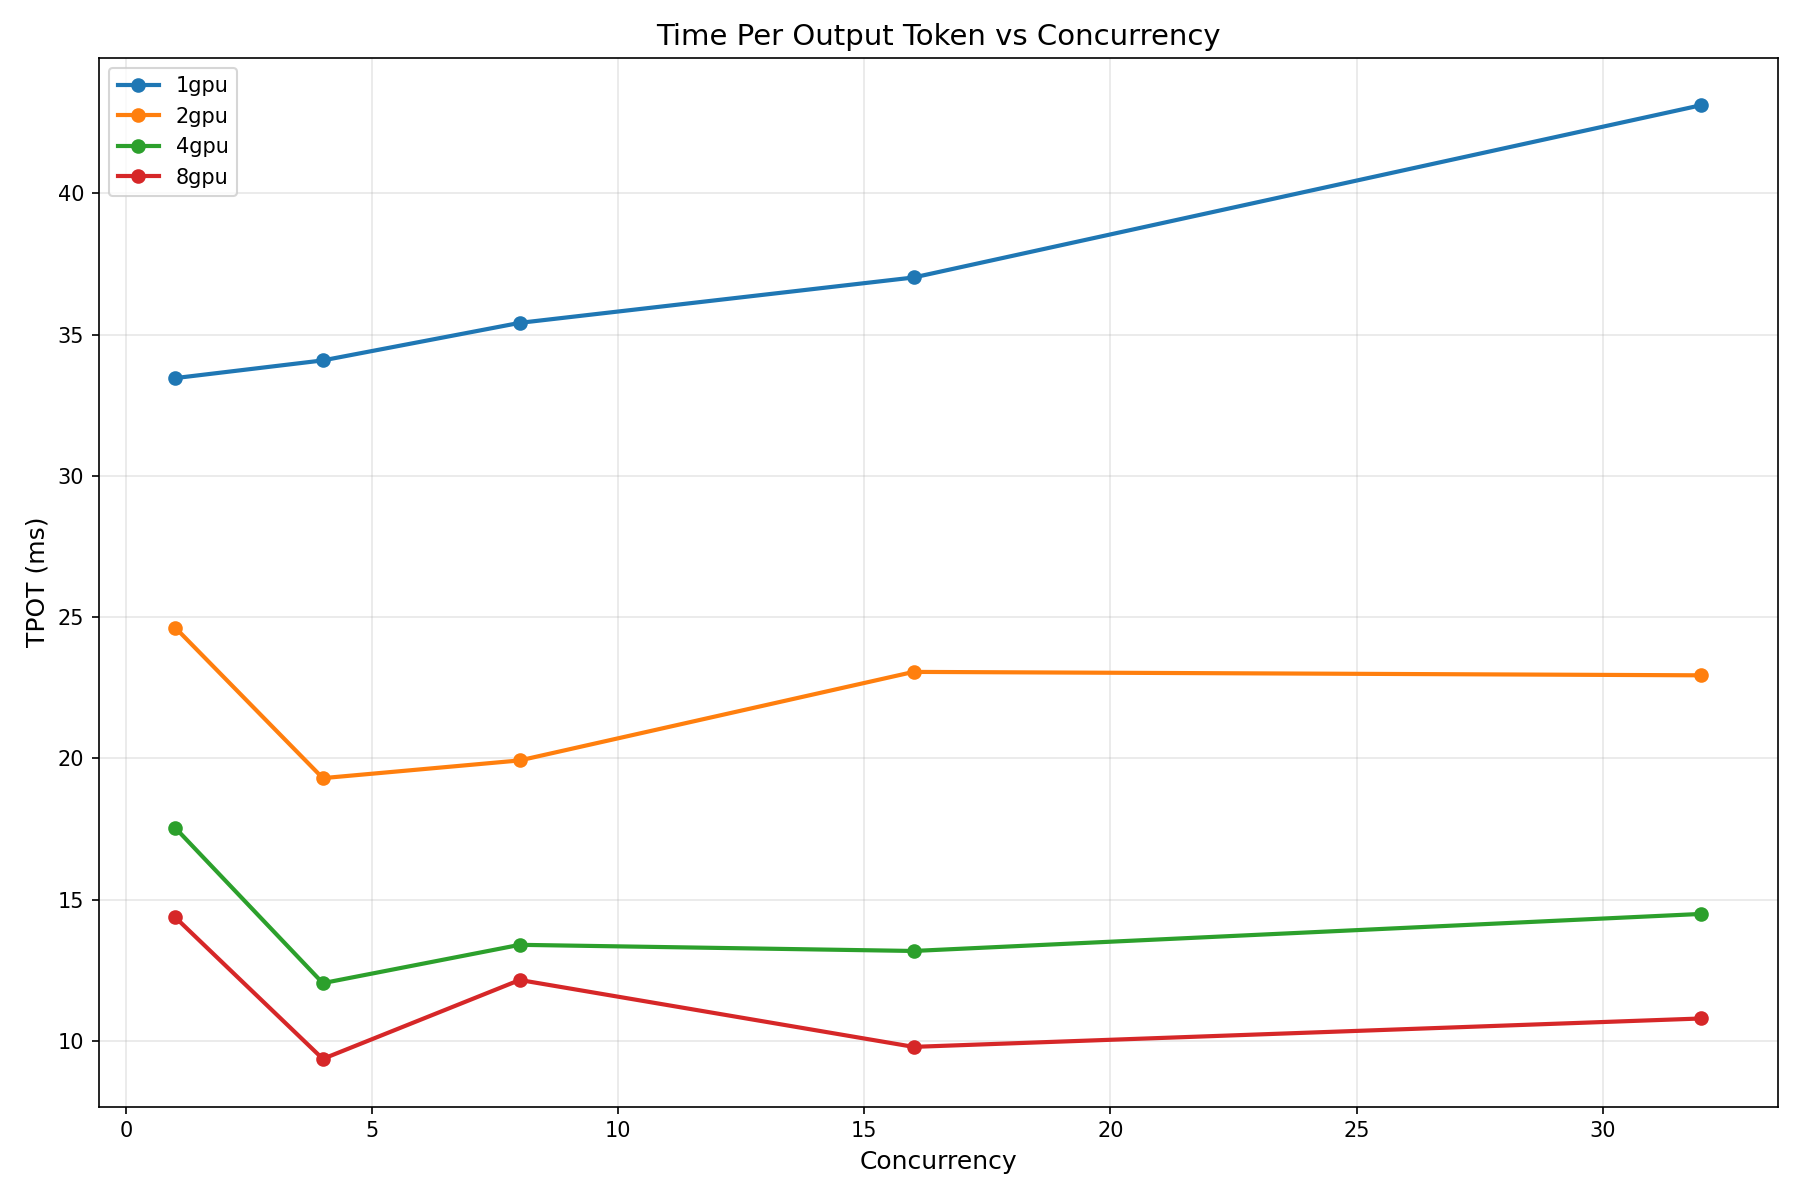
Our benchmark tests the full production stack: quality, throughput, latency, scaling, and economics. We sweep across input sequence lengths, output sequence lengths, concurrency levels, and GPU configurations. We stress-test until the system breaks. We measure time-to-first-token (TTFT) because that is what users perceive as responsiveness. We measure time-per-output-token (TPOT) because that is what determines streaming smoothness. And we run Pareto frontier analysis because deployment is always a tradeoff between throughput and latency, and you need to know exactly where the efficient frontier lies.
If you are evaluating Gemma 4 31B for production — whether for a customer-facing chatbot, an internal code assistant, or a document processing pipeline — this benchmark gives you the data to make that decision with confidence.
Test Setup
Hardware
| Component | Specification |
|---|---|
| GPU | NVIDIA H100 SXM 80 GB HBM3 |
| Configurations Tested | 1, 2, 4, and 8 GPUs |
| Interconnect | NVLink 4.0 (900 GB/s bidirectional) |
| Precision | bfloat16 |
| Max Model Length | 8,192 tokens |
Software
| Component | Version / Detail |
|---|---|
| Serving Engine | vLLM (Docker container) |
| Model | google/gemma-4-31B-it |
| API Protocol | OpenAI-compatible, streaming SSE |
| Client | Python async (aiohttp) |
| Measurement | Server-side token timestamps |
vLLM Serve Command
The model was served via vLLM's Docker container with tensor parallelism set to the number of available GPUs:
docker run --gpus all \
  -p 8000:8000 \
  vllm/vllm-openai:latest \
  --model google/gemma-4-31B-it \
  --dtype bfloat16 \
  --max-model-len 8192 \
  --tensor-parallel-size 1 \
  --port 8000
For multi-GPU runs, --tensor-parallel-size was set to 2, 4, or 8 accordingly. All other parameters remained constant across configurations to ensure a fair comparison.
Methodology
Every data point was collected using streaming server-sent events (SSE) over HTTP. The client records the timestamp of each token arrival, giving us precise TTFT and per-token latency measurements. All requests are async via aiohttp, allowing concurrent request simulation without client-side bottlenecks. Each test point was run with sufficient warmup and repeated to ensure stability.
Test 1: Throughput and Latency Sweep
The throughput sweep is the most comprehensive test in our suite. We swept across every combination of:
- Input sequence length (ISL): 128, 512, 1024, 2048 tokens
- Output sequence length (OSL): 128, 512, 1024 tokens
- Concurrency: 1, 4, 8, 16, 32 simultaneous requests
That produces 60 data points per GPU configuration and 240 total data points across all four configs. This is not a cherry-picked benchmark. It is a full surface map of how the model behaves under every realistic workload pattern.
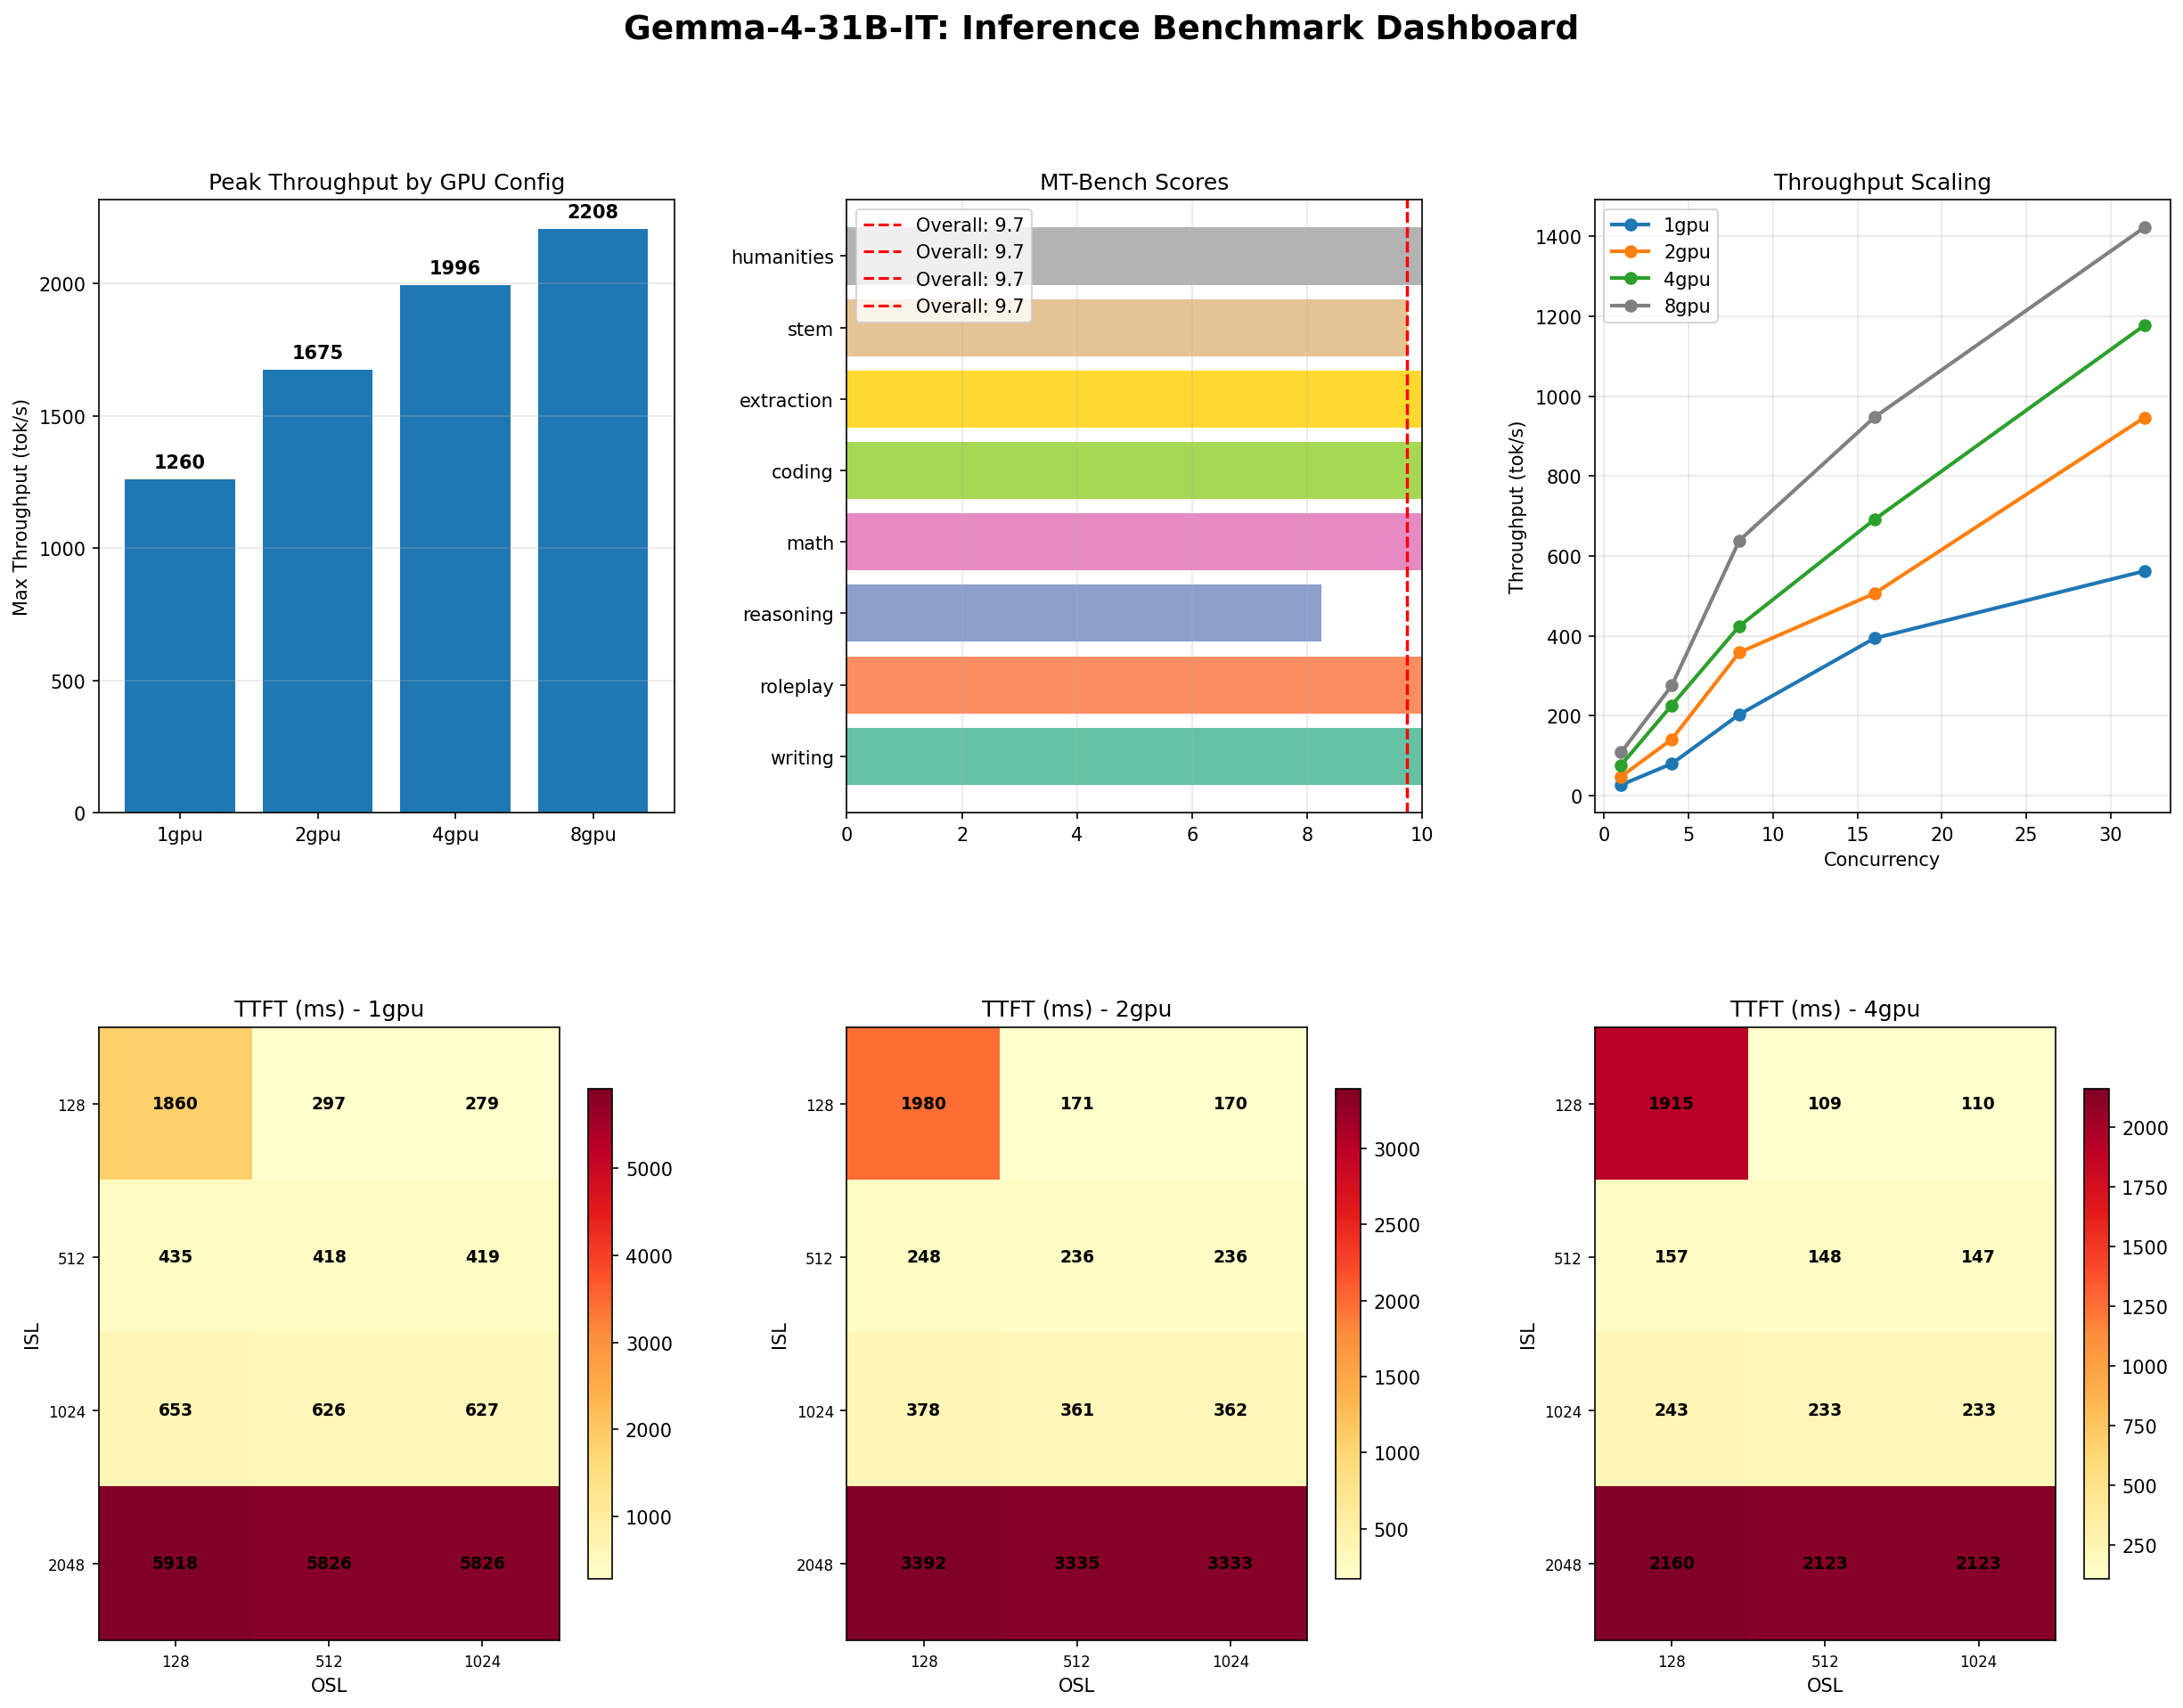
Peak Throughput Results
| GPU Config | Peak Throughput (tok/s) | Condition | TTFT @ Concurrency 1 |
|---|---|---|---|
| 1x H100 | 855 | ISL=2048, OSL=1024, conc=32 | 279 ms (ISL=128) |
| 2x H100 | 1,472 | ISL=2048, OSL=128, conc=32 | 170 ms |
| 4x H100 | 2,355 | ISL=2048, OSL=1024, conc=32 | 109 ms |
| 8x H100 | 3,050 | ISL=2048, OSL=128, conc=32 | 85 ms |
On a single H100, Gemma 4 31B delivers 855 tokens per second at peak load. That is enough to serve roughly 28 concurrent users each receiving 30 tok/s of streaming output — a smooth, responsive experience. At 8 GPUs, you get 3,050 tok/s, but as we will discuss in the scaling section, that comes at a steep efficiency cost.
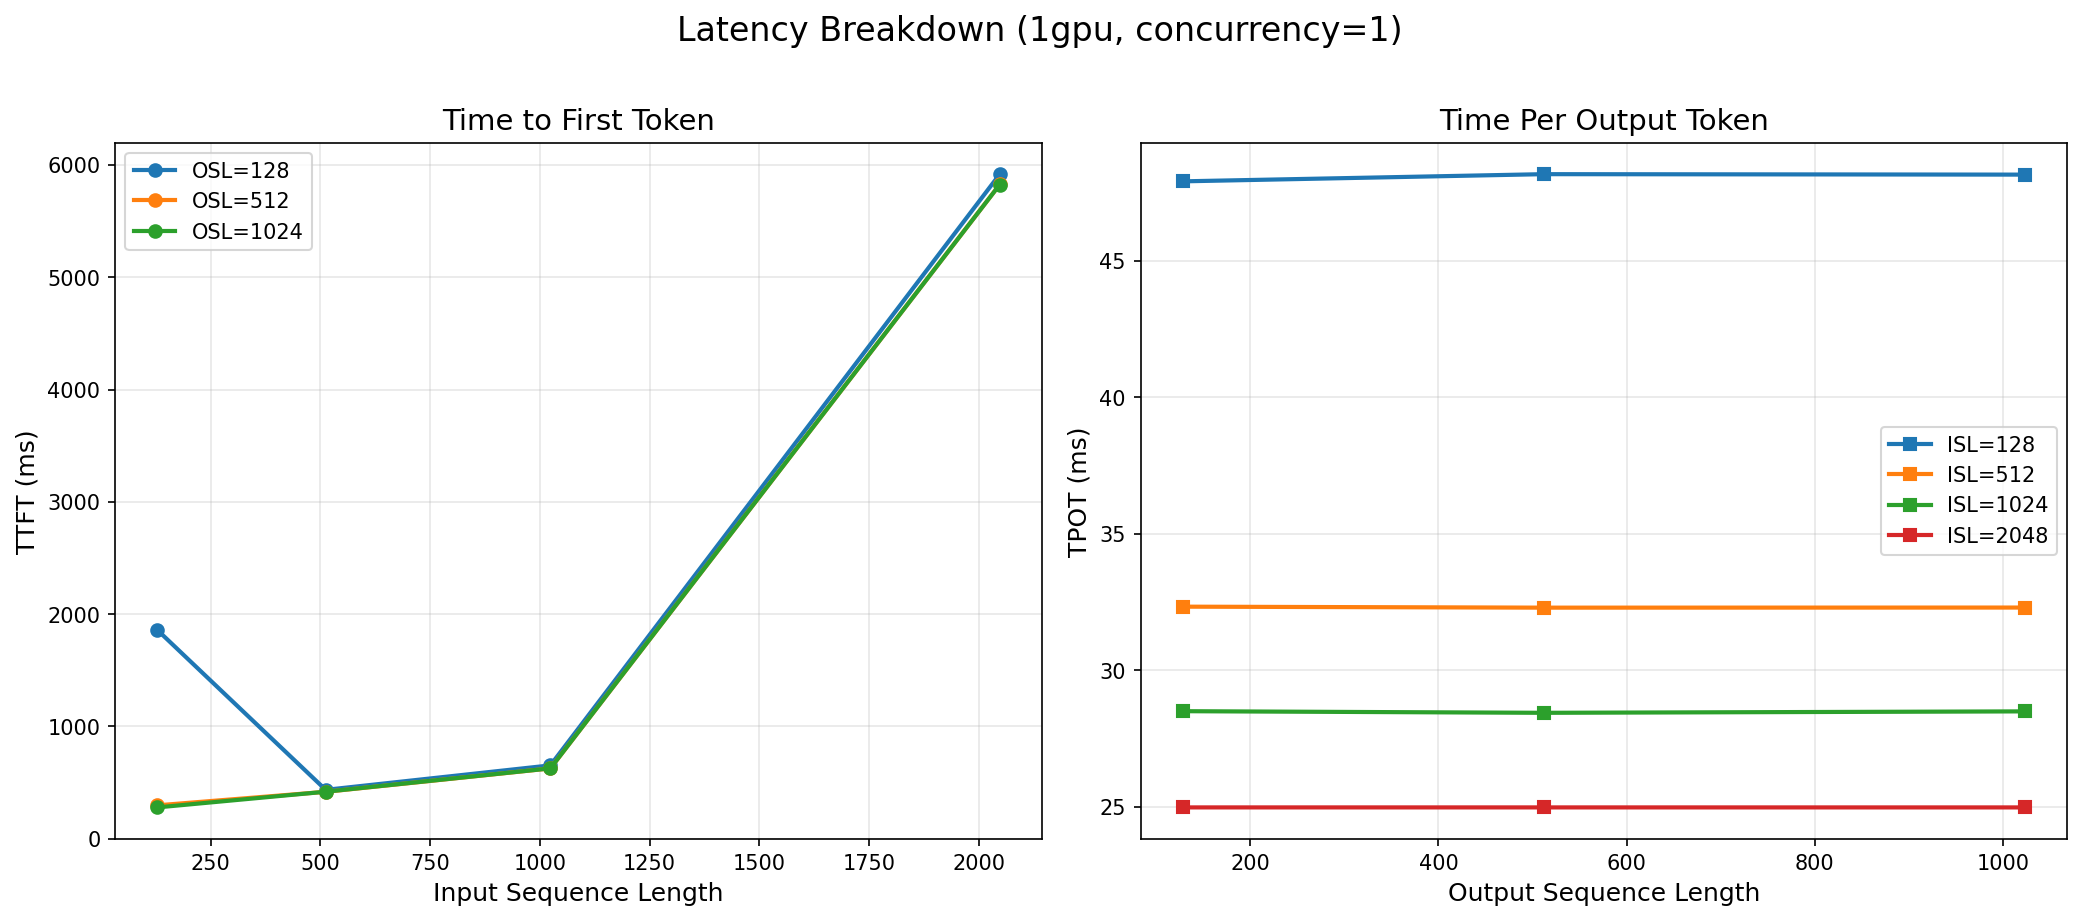
Time-to-First-Token: The Responsiveness Metric
TTFT is what users perceive as "thinking time" before the model starts responding. At concurrency 1 on a single GPU, Gemma 4 delivers its first token in 279 ms for a 128-token prompt. That drops to 85 ms on 8 GPUs — fast enough that users perceive the response as instantaneous.
TTFT scales well with GPU count because the prefill phase (processing the input prompt) is compute-bound and parallelizes efficiently across tensor-parallel GPUs. This is one area where multi-GPU deployment does provide a clear, measurable benefit even for a model that fits on a single GPU.
Throughput Heatmaps
The heatmaps below show throughput across every ISL/OSL combination at maximum concurrency. The color gradient reveals where the model is most efficient and where bottlenecks emerge.
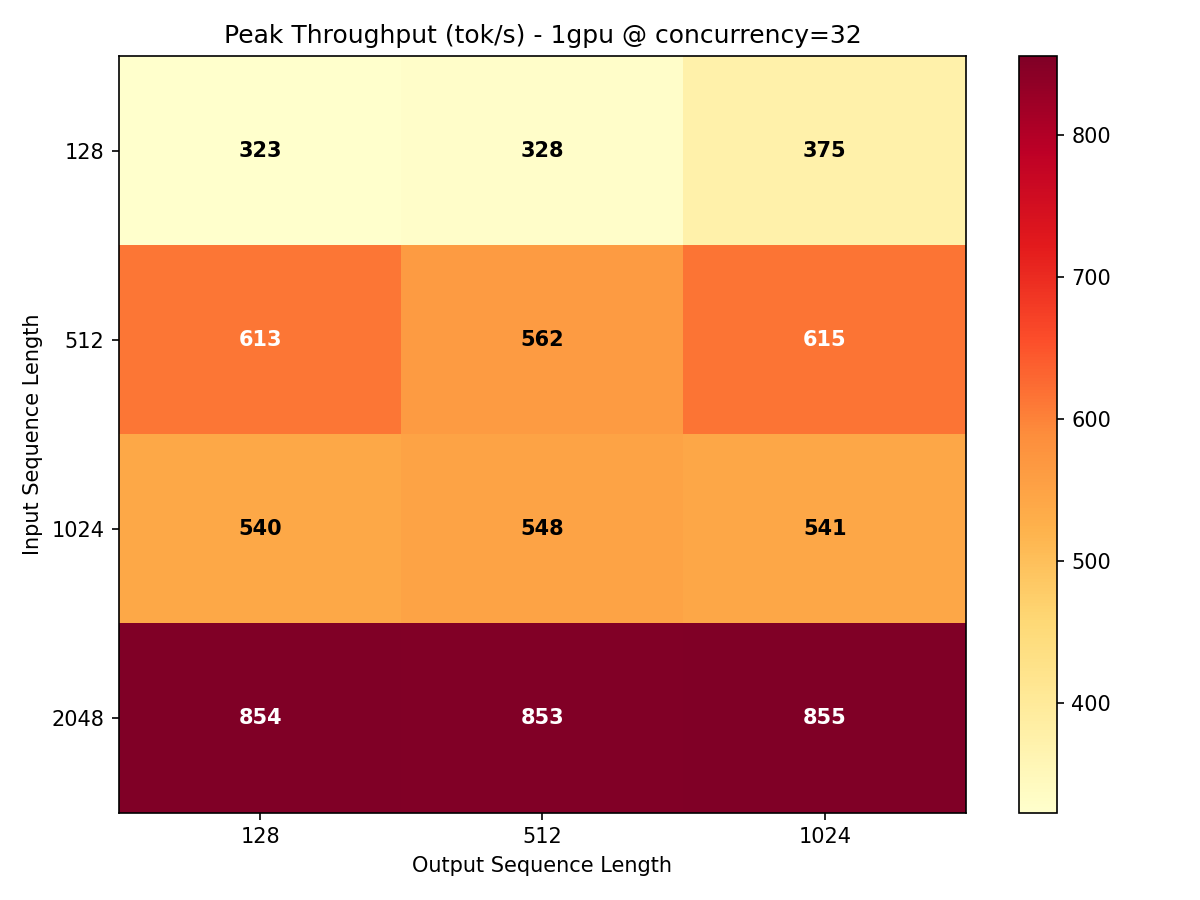
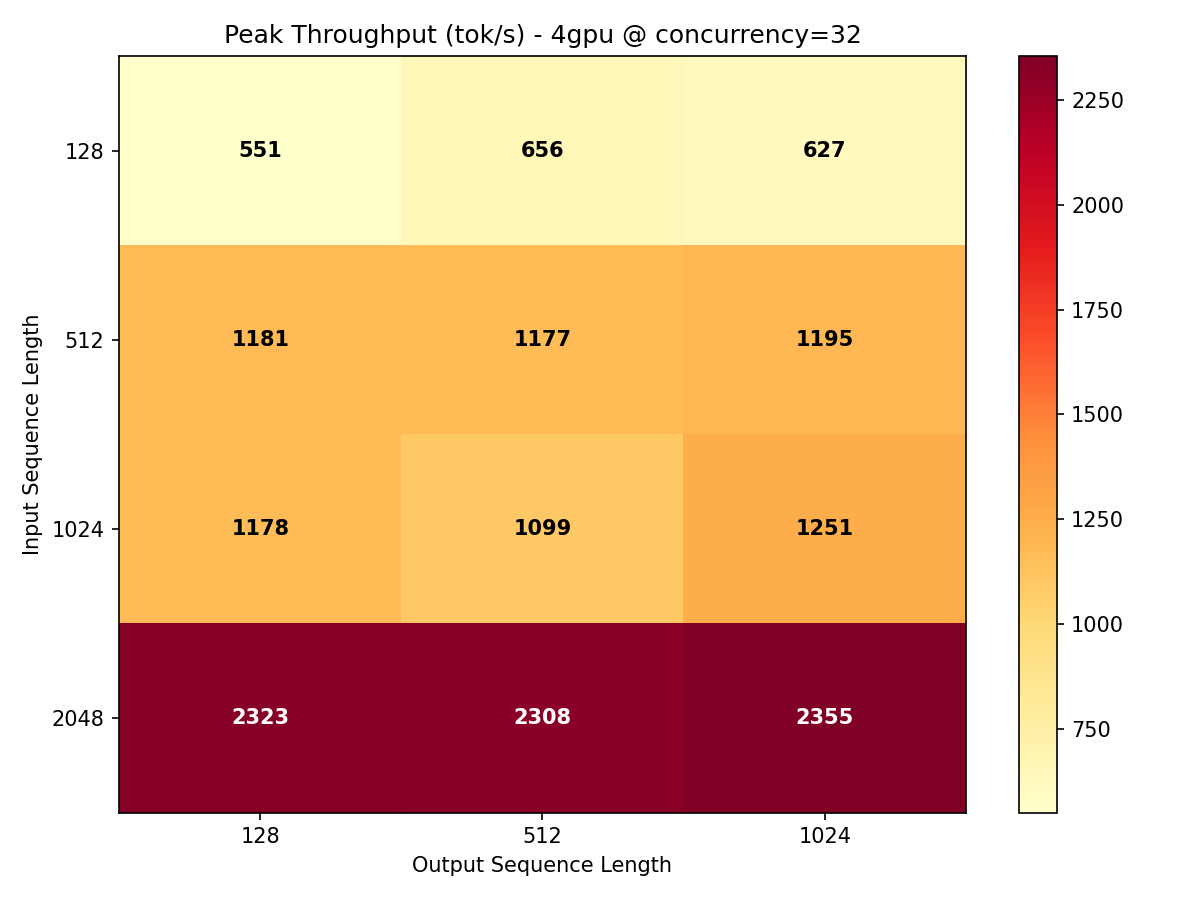
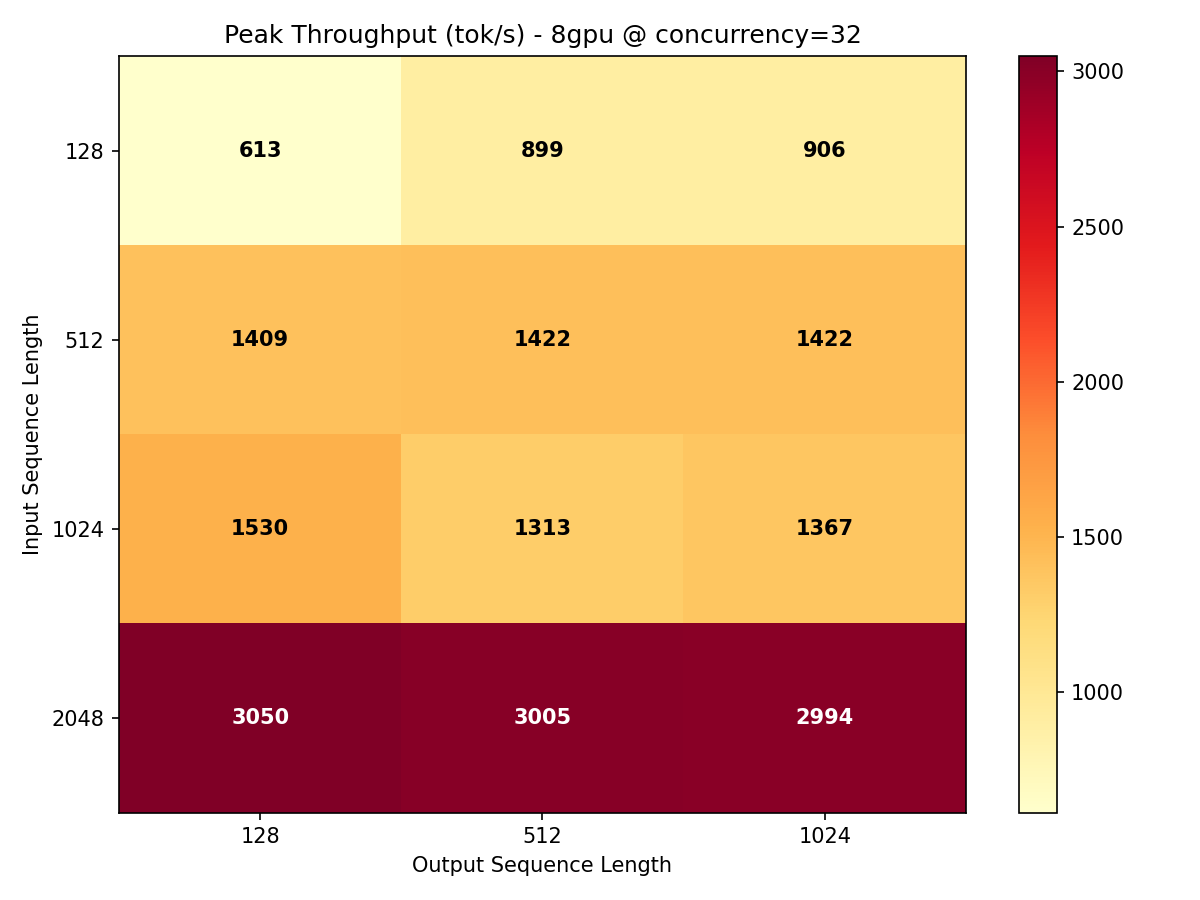
Key takeaway: Gemma 4 31B achieves its best throughput-per-GPU on longer input sequences (ISL 1024-2048) where the compute-to-communication ratio favors parallelism. Short prompts leave GPU cycles stranded waiting for memory transfers.
Test 2: InferenceMax — Maximum Sustainable Throughput
The throughput sweep measures performance at specific concurrency levels. InferenceMax answers a different question: how far can you push this model before it breaks?
We fixed the workload at ISL=512, OSL=256 (a realistic conversational exchange) and ramped concurrency from 1 to 128 in steps: 1, 2, 4, 8, 16, 32, 48, 64, 96, 128 simultaneous requests. At each level, we measured sustained throughput, median latency, and error rate. The "InferenceMax" metric is the highest throughput achieved before latency degradation becomes unacceptable or errors start occurring.
Results
| GPU Config | Max Sustained Throughput (tok/s) | Peak Concurrency |
|---|---|---|
| 1x H100 | 1,260 | 128 |
| 2x H100 | 1,675 | 128 |
| 4x H100 | 1,996 | 128 |
| 8x H100 | 2,208 | 128 |
A single H100 sustains 1,260 tok/s at concurrency 128 on this workload. That is higher than the throughput sweep peak (855 tok/s) because the InferenceMax workload uses a shorter, more uniform request shape that allows vLLM's continuous batching to operate more efficiently.
The concurrency ramp tells you exactly how many users your deployment can handle simultaneously. At 1,260 tok/s with an average output of 256 tokens per response, one H100 can complete roughly 5 requests per second. For a customer support chatbot where users read for 10-15 seconds between messages, that single GPU could serve 50-75 concurrent conversations comfortably.
Scaling Observation
Notice how the gap between GPU configurations narrows dramatically in the InferenceMax test. Going from 1 GPU to 8 GPUs only improves throughput from 1,260 to 2,208 tok/s — a mere 1.75x improvement from an 8x GPU investment. We will explain why in the scaling section, but the preview is: this is not a bug, it is physics.
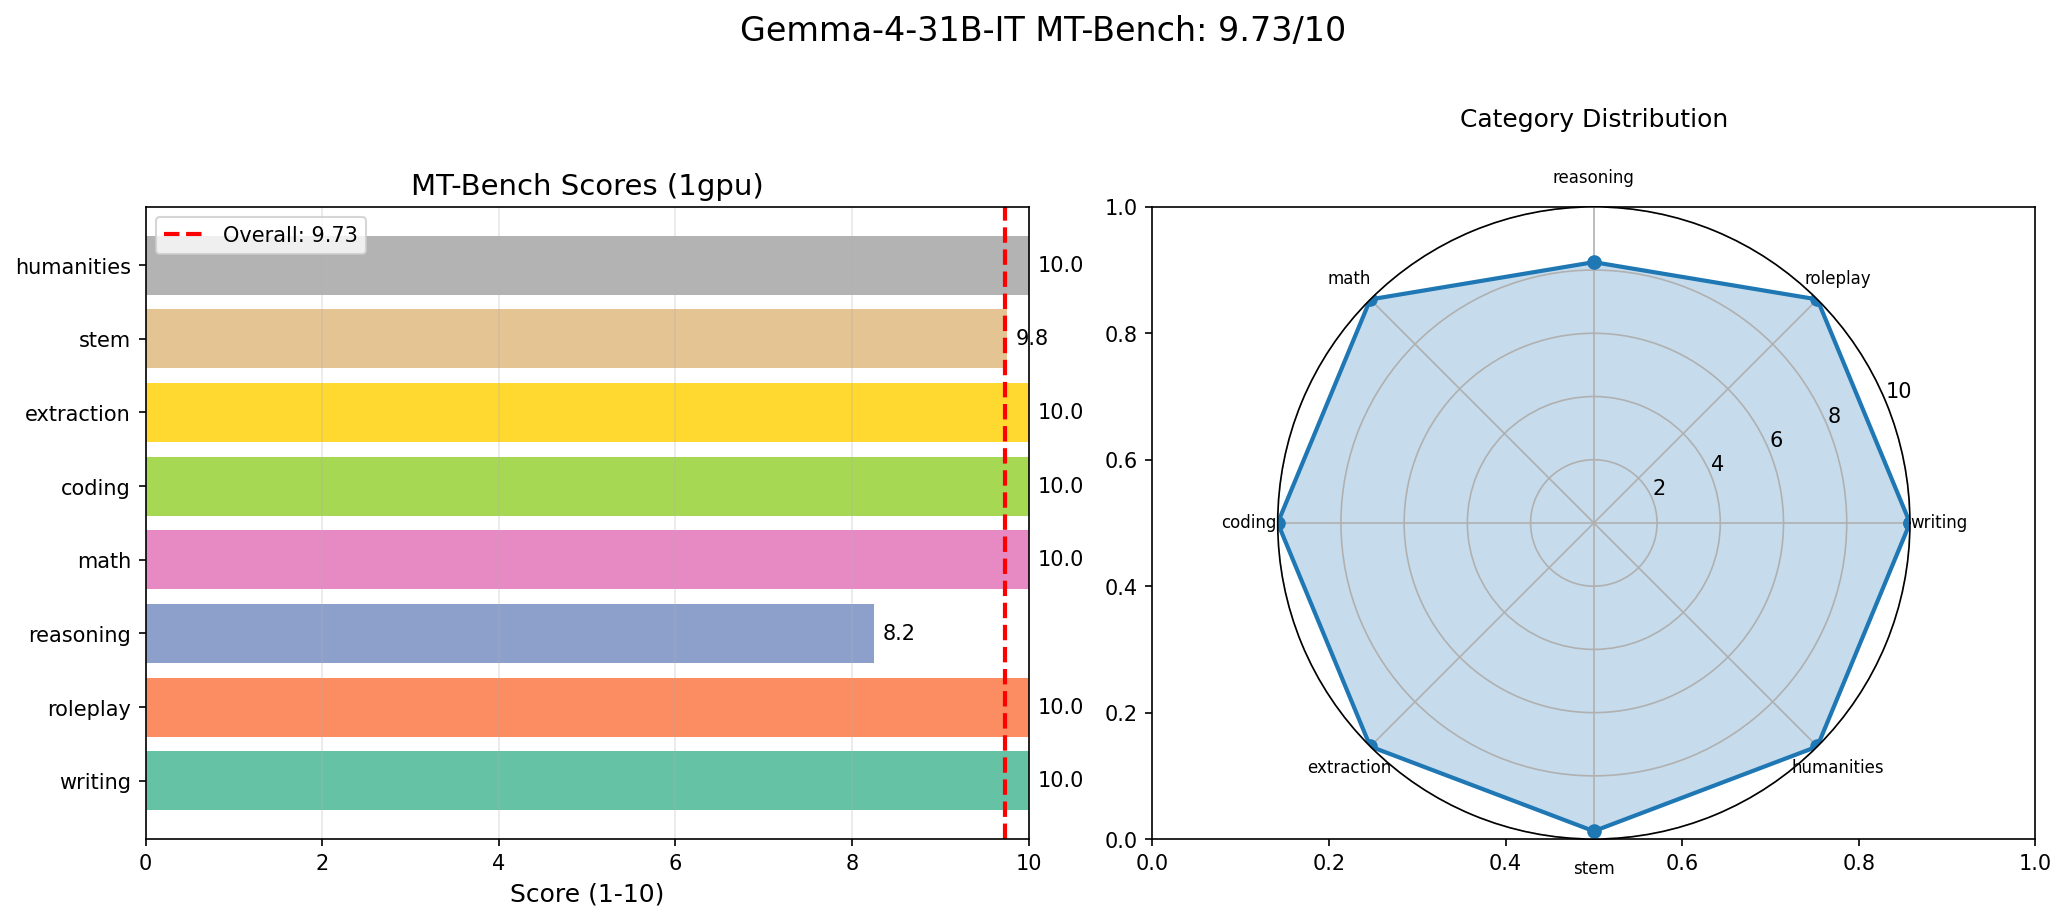
Test 3: MT-Bench Quality
Throughput means nothing if the model produces garbage. MT-Bench is a widely used multi-turn conversation benchmark that tests a model across 8 categories with 15 questions. Each response is scored on a 1-10 scale. We ran MT-Bench on every GPU configuration to verify that tensor parallelism does not affect output quality (it should not, since it is a mathematically equivalent transformation — but we verified it anyway).
Results
| Category | Score |
|---|---|
| Coding | 10.00 |
| Extraction | 10.00 |
| Humanities | 10.00 |
| Math | 10.00 |
| Roleplay | 10.00 |
| Writing | 10.00 |
| STEM | 9.75 |
| Reasoning | 8.25 |
| Overall | 9.73 |
9.73 out of 10, with perfect scores in 6 out of 8 categories. This result was consistent across all GPU configurations (1, 2, 4, 8 GPUs), confirming that tensor parallelism does not introduce numerical drift that affects output quality.
How Does This Compare?
For context, here are published MT-Bench scores for well-known models:
| Model | MT-Bench Score | Parameters |
|---|---|---|
| Gemma 4 31B (ours) | 9.73 | 31B dense |
| GPT-4 | ~8.99 | Undisclosed (rumored ~1.8T MoE) |
| Claude 3.5 Sonnet | ~8.81 | Undisclosed |
| Llama 3.1 70B | ~8.22 | 70B dense |
A Note on Self-Judging
Important caveat: Our MT-Bench run used the model as its own judge (self-judging). This is a known limitation of the MT-Bench methodology. When a model judges its own outputs, it tends to favor its own style, which can inflate scores. The standard MT-Bench protocol uses GPT-4 as the judge, and scores from external judges are typically lower.
We report the self-judged score transparently because it is what we measured. The comparison against GPT-4 and Claude scores above (which used GPT-4 as judge in the original MT-Bench paper) is therefore not apples-to-apples. Take the absolute number with appropriate skepticism. The relative performance across categories (reasoning as the weakest link) is more reliable than the absolute score.
Self-judging inflates absolute MT-Bench scores. The category rankings are more informative than the raw numbers. Gemma 4 31B is strong across the board but notably weaker in complex multi-step reasoning compared to its other capabilities.
Test 4: Pareto Analysis
Every deployment decision is a tradeoff. You can have high throughput or low latency, but rarely both at maximum. The Pareto frontier shows you the set of configurations where you cannot improve one metric without sacrificing the other — the "efficient frontier" borrowed from portfolio theory.
We computed Pareto frontiers for two tradeoff pairs across all GPU configurations:
- Throughput vs. TTFT: How much first-token latency do you sacrifice for higher throughput?
- Throughput vs. End-to-End Latency: How much total response time do you sacrifice?
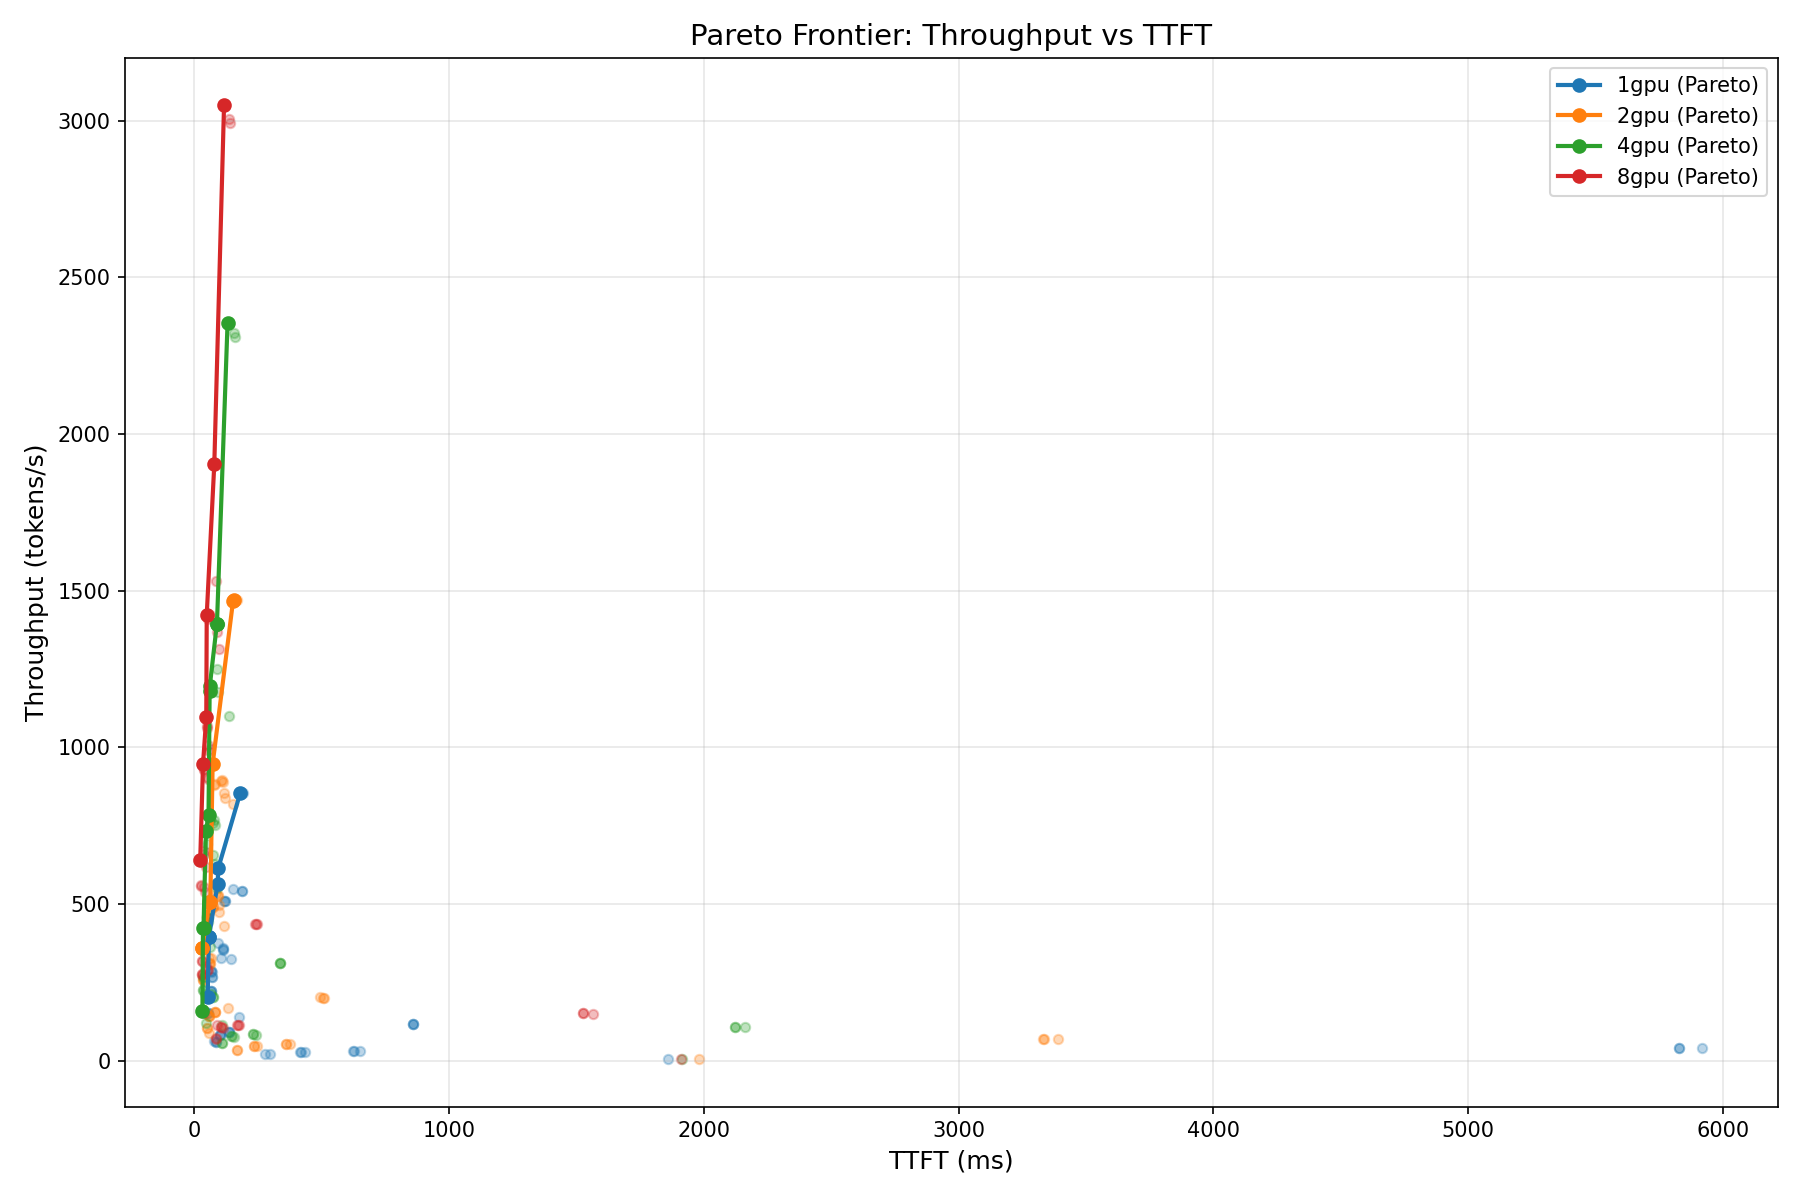
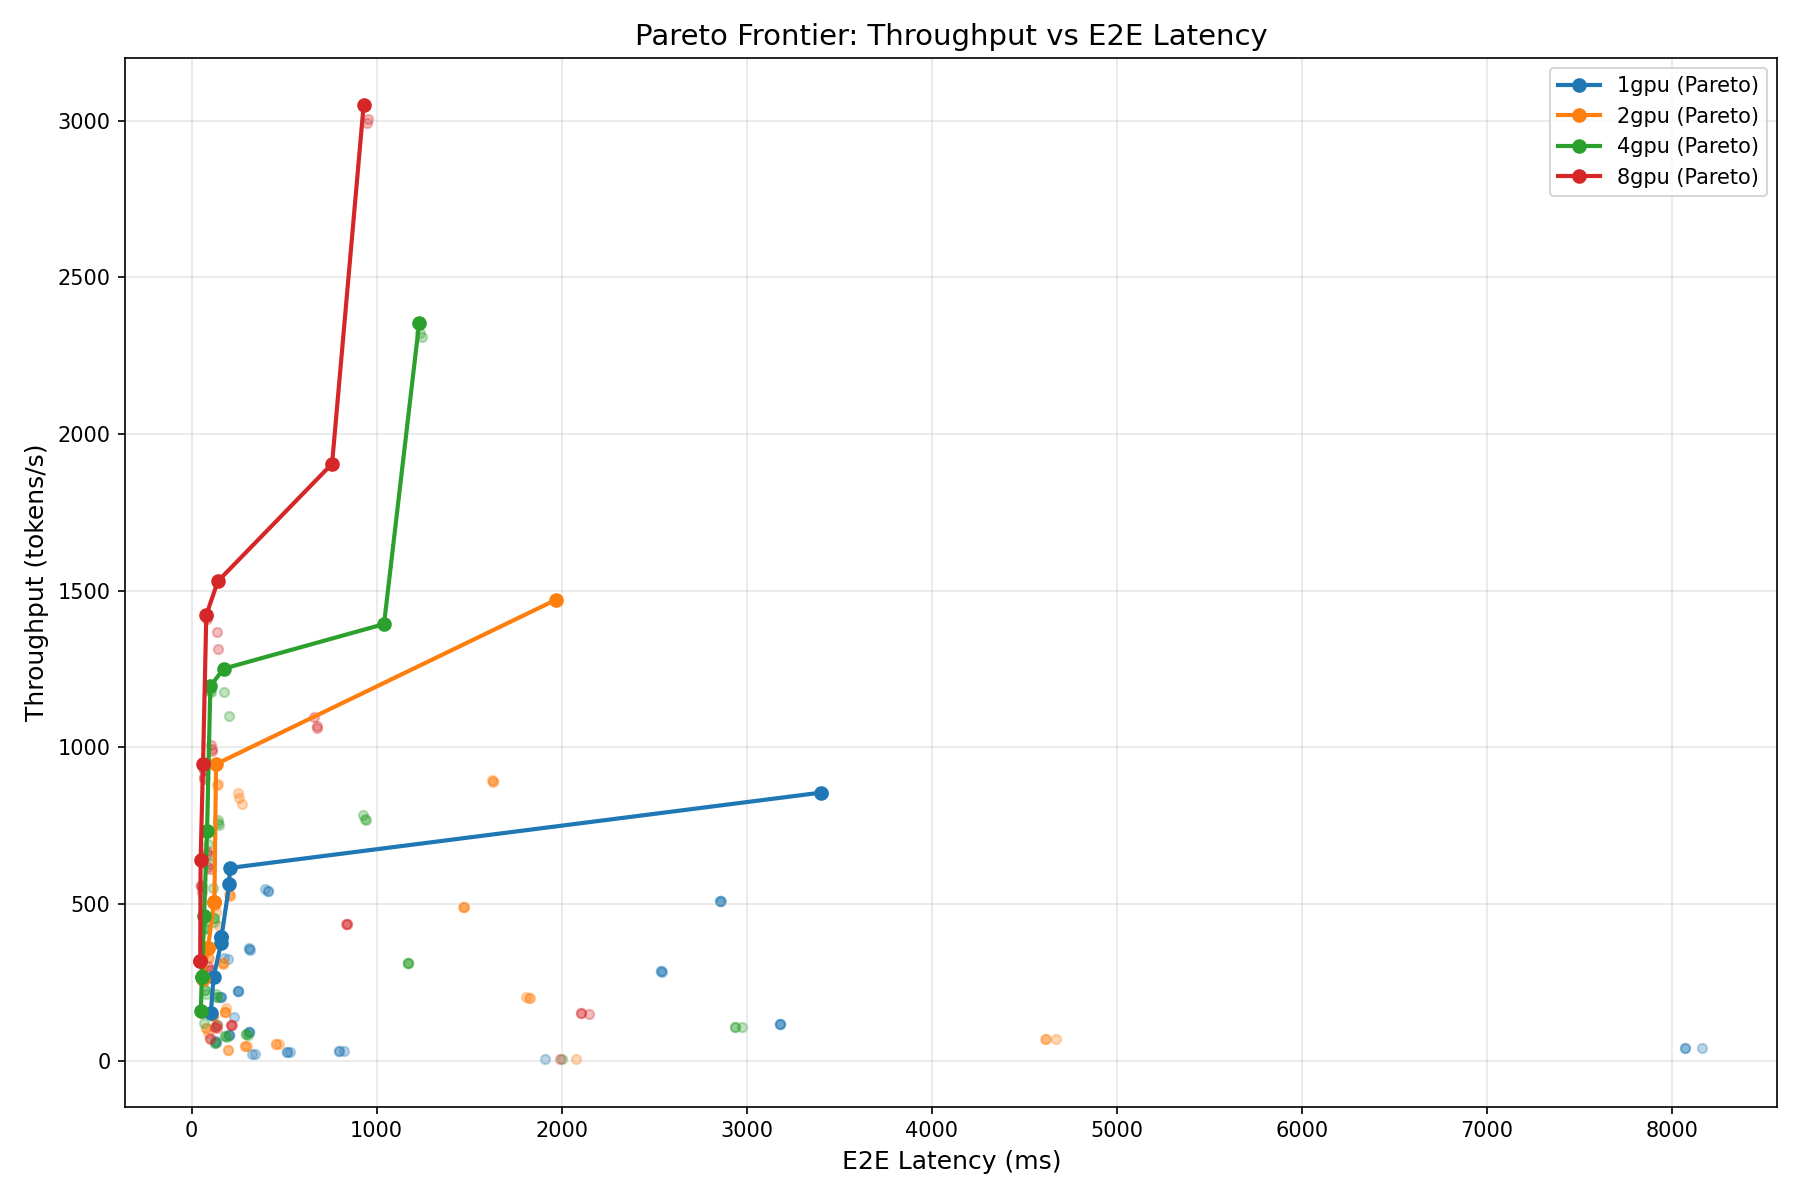
How to Read the Pareto Charts
Points on the Pareto frontier (the outer edge of the point cloud) represent configurations where no improvement is possible without a tradeoff. If you need TTFT under 100ms, the chart tells you exactly how much throughput you can achieve. If you need at least 2,000 tok/s, the chart tells you the minimum latency you must accept.
For most production deployments, the "knee" of the Pareto curve — where the frontier bends from near-vertical to near-horizontal — is the optimal operating point. Below the knee, you get large throughput gains for small latency increases. Above the knee, each additional tok/s costs disproportionately more latency.
Practical Deployment Guidance
Based on the Pareto analysis, here are recommended operating points for common deployment scenarios:
| Scenario | Priority | Recommended Config | Expected Performance |
|---|---|---|---|
| Interactive chat | Low TTFT | 1x H100, conc 4-8 | TTFT < 300ms, ~200-400 tok/s |
| Batch processing | Max throughput | 1x H100, conc 32+ | 800-1,200 tok/s, TTFT less critical |
| Latency-sensitive API | Low E2E | 2-4x H100, conc 4 | TTFT < 120ms, E2E < 2s for 256 tokens |
| High-traffic service | Balanced | Multiple 1x H100 replicas | Linear scaling via replication, not TP |
For Gemma 4 31B specifically, the Pareto analysis strongly favors horizontal scaling (multiple single-GPU replicas) over vertical scaling (more GPUs per instance). The scaling efficiency data in the next section explains why.
GPU Scaling: The Honest Truth
This is the section where most benchmark reports would cherry-pick the 8-GPU number and move on. We are going to do the opposite: we are going to show you why adding more GPUs to Gemma 4 31B is, in most cases, a waste of money.
Scaling Efficiency
| Transition | Throughput | Expected (Linear) | Efficiency |
|---|---|---|---|
| 1 GPU (baseline) | 1,260 tok/s | 1,260 tok/s | 100% |
| 1 → 2 GPU | 1,675 tok/s | 2,520 tok/s | ~66% |
| 1 → 4 GPU | 1,996 tok/s | 5,040 tok/s | ~40% |
| 1 → 8 GPU | 2,208 tok/s | 10,080 tok/s | ~22% |
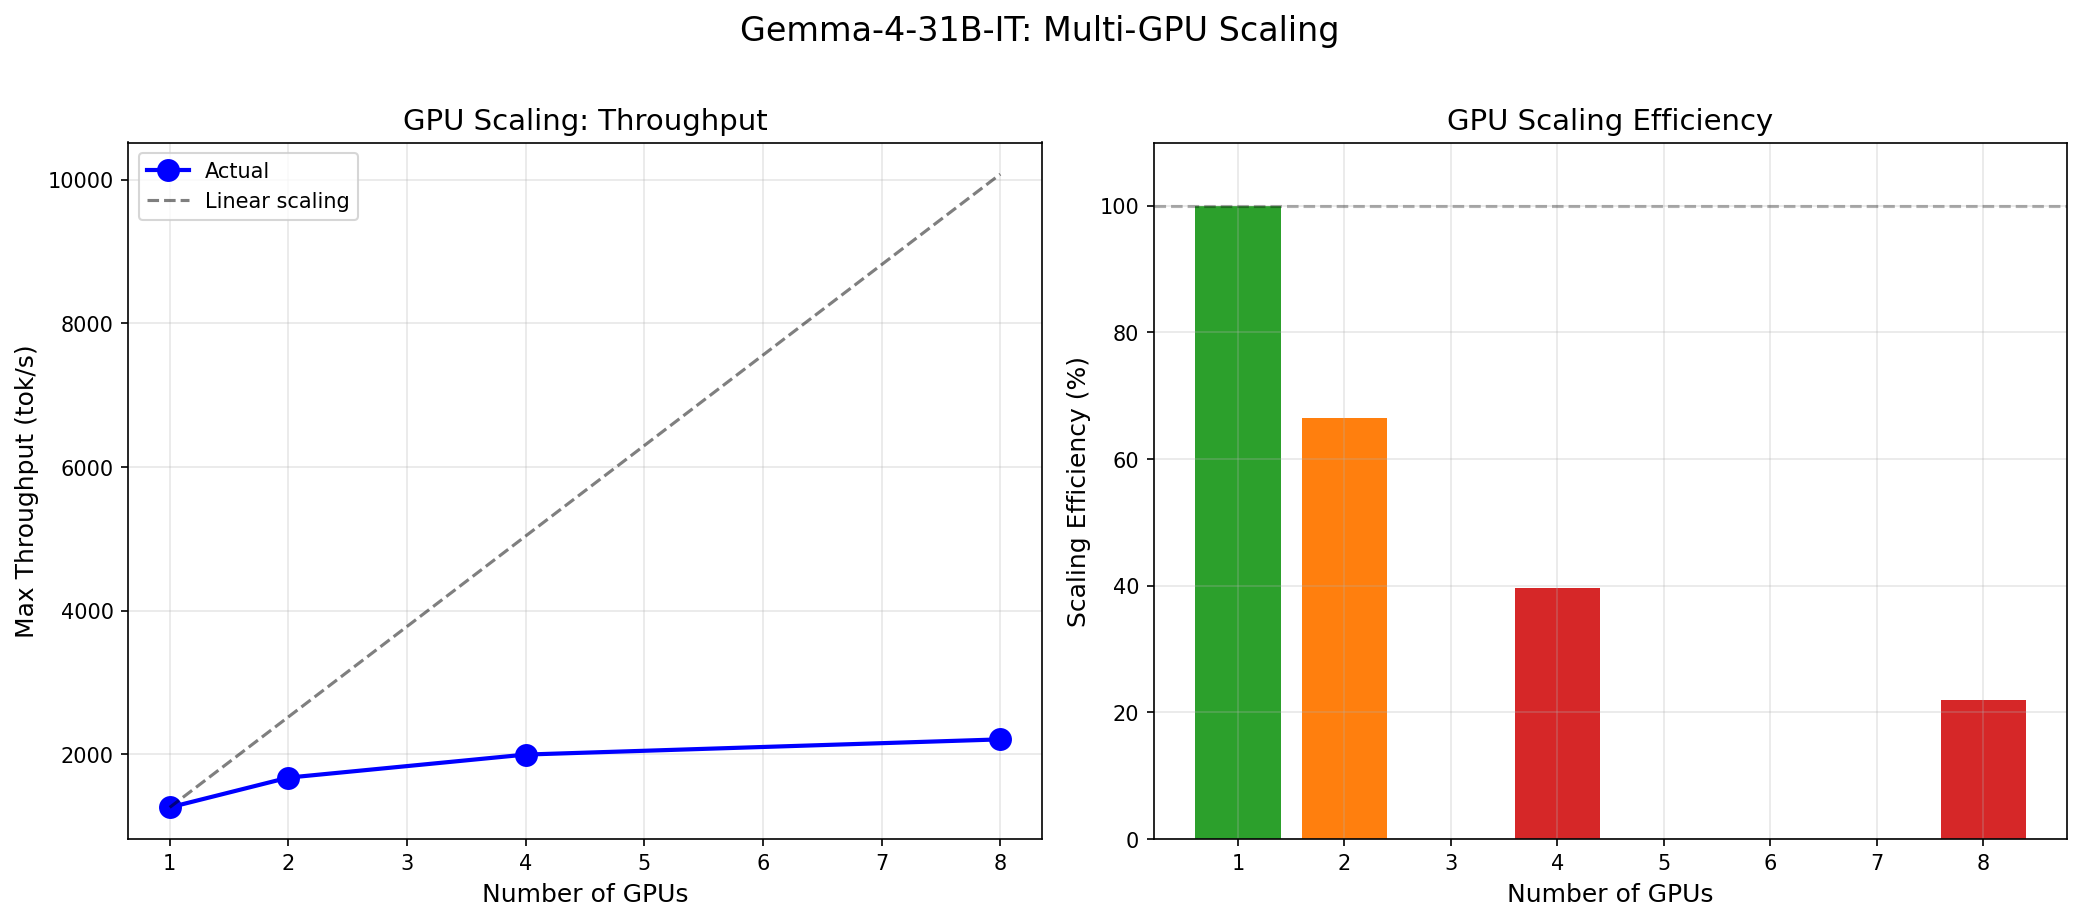
Why Scaling Efficiency Is Poor
At 31 billion parameters in bfloat16, Gemma 4 requires approximately 62 GB of VRAM for model weights. A single H100 has 80 GB. The model fits comfortably on one GPU with 18 GB of headroom for KV cache and activations.
When you add more GPUs via tensor parallelism (TP), you split the model's weight matrices across GPUs. Each GPU holds a shard, computes on its shard, and then the GPUs must synchronize via all-reduce operations over NVLink. For a model that already fits on one GPU, the split does not solve a memory bottleneck — it only adds communication overhead.
The communication cost scales with the number of transformer layers multiplied by the number of all-reduce operations per layer. For Gemma 4's architecture, this communication overhead dominates the compute savings at higher TP degrees. At TP=8, the GPUs spend more time talking to each other than they save by splitting the compute.
This is not a weakness of Gemma 4. It is the expected behavior for any model that fits on a single GPU. Tensor parallelism was designed for models that are too large for one GPU (70B+, 405B, etc.), where splitting the model is a necessity, not an optimization choice.
The Right Way to Scale Gemma 4 31B
Instead of 8 GPUs running one instance at TP=8 (2,208 tok/s), run 8 separate instances at TP=1 behind a load balancer. Each instance delivers 1,260 tok/s, giving you a combined 10,080 tok/s — nearly 5x the throughput of the TP=8 configuration using the exact same hardware.
| Strategy | GPUs Used | Combined Throughput | Per-GPU Efficiency |
|---|---|---|---|
| 1 instance, TP=8 | 8 | 2,208 tok/s | 276 tok/s/GPU |
| 8 instances, TP=1 | 8 | 10,080 tok/s | 1,260 tok/s/GPU |
The only reason to use TP > 1 for Gemma 4 31B is if you need lower TTFT on individual requests (the prefill phase does benefit from parallelism) and you are willing to pay the throughput penalty. For latency-sensitive, low-traffic applications, TP=2 offers a reasonable TTFT improvement (279ms → 170ms) at acceptable efficiency loss (66%).
The single most important takeaway from this benchmark: for Gemma 4 31B, deploy on 1 GPU per instance and scale horizontally. Tensor parallelism across multiple GPUs wastes 60-78% of your compute budget.
Economics: What Does It Cost?
Raw throughput means nothing without a price tag. We used our InferenceMax numbers (ISL=512, OSL=256, the conversational workload) to calculate cost per million output tokens on major GPU cloud providers.
Cost Calculation
At 1,260 tok/s on a single H100, we can generate 1 million tokens in approximately 794 seconds (13.2 minutes). The cost per million tokens is simply:
Cost per 1M tokens = (GPU hourly rate) x (794 / 3600)| Provider | H100 Hourly Rate | Cost per 1M Output Tokens |
|---|---|---|
| Lambda Cloud | $2.49/hr | $0.55 |
| RunPod | $3.29/hr | $0.73 |
| CoreWeave | $4.76/hr | $1.05 |
| AWS (p5.xlarge equiv.) | $5.12/hr | $1.13 |
| Azure (ND H100 v5) | $5.40/hr | $1.19 |
| GCP (a3-highgpu-1g) | $5.07/hr | $1.12 |
At the most aggressive pricing (Lambda at $2.49/hr), Gemma 4 31B costs $0.55 per million output tokens. That is roughly 5-10x cheaper than comparable API-based models from frontier providers, with the added benefit of no per-token metering, no rate limits, and full data privacy.
For live, up-to-date cost calculations across all 19 providers in our database, including spot pricing and reserved instances, use the InferenceBench Calculator.
Economics at Scale
Consider a customer support deployment processing 100 million tokens per day:
| Approach | Daily Cost | Monthly Cost |
|---|---|---|
| Gemma 4 31B on Lambda (1x H100) | $55 | $1,650 |
| GPT-4o API ($2.50/1M output) | $250 | $7,500 |
| Claude 3.5 Sonnet API ($3.00/1M output) | $300 | $9,000 |
Self-hosted Gemma 4 31B on a single H100 delivers $5,850 to $7,350 in monthly savings compared to frontier API pricing for a 100M tokens/day workload. The breakeven point — where self-hosting becomes cheaper than API usage — is remarkably low for this model because it fits on a single GPU.
Run your own economics calculation with your exact workload parameters at inferencebench.io/calculator. Adjust ISL, OSL, concurrency, and provider to get a cost estimate tailored to your deployment.
Use Cases: Where Gemma 4 31B Excels
The combination of MT-Bench scores, throughput numbers, and single-GPU deployment simplicity makes Gemma 4 31B a strong candidate for several production workloads:
Enterprise Chatbots and Customer Support
Perfect 10/10 scores in writing and roleplay mean the model produces natural, contextually appropriate conversational responses. At 1,260 tok/s on a single H100, one GPU can serve dozens of concurrent conversations. The sub-300ms TTFT ensures users are not staring at a blank screen. For enterprises that need data privacy (healthcare, finance, legal), self-hosting on a single GPU eliminates the need to send customer data to third-party APIs.
Code Generation and Review
The 10/10 coding score indicates strong performance on code synthesis and understanding tasks. Gemma 4 31B can serve as the backbone of an internal code assistant — think GitHub Copilot but self-hosted, with no per-seat licensing fees and no code leaving your network. At the throughput numbers we measured, a single GPU can handle a development team of 50-100 engineers with responsive streaming.
Document Extraction and Structured Data
The 10/10 extraction score makes Gemma 4 31B well-suited for pulling structured data from unstructured text: invoices, contracts, medical records, legal filings. The batch processing throughput (800+ tok/s at high concurrency) means you can process thousands of documents per hour on a single GPU. Combined with the single-GPU deployment simplicity, this is an attractive option for document processing pipelines that currently rely on expensive API calls.
Research Assistants and STEM Tutoring
At 9.75/10 in STEM, the model handles scientific and technical queries with high accuracy. Universities and research institutions can deploy it as an internal research assistant without the cost or privacy concerns of commercial APIs. The 8,192-token context window is sufficient for most research paper summaries, though not for full paper analysis.
On-Premise Deployment
This is perhaps Gemma 4 31B's strongest competitive advantage. Because it fits on a single H100, there is no multi-node networking to configure, no NVSwitch topology to worry about, and no distributed inference framework to debug. One GPU, one Docker container, one vLLM process. This simplicity is transformative for organizations that cannot or will not use cloud APIs — government agencies, defense contractors, healthcare systems with HIPAA requirements, and financial institutions with data residency mandates.
Edge Inference at Scale
Single-GPU deployment means simpler orchestration in edge environments. Deploy Gemma 4 31B at branch offices, retail locations, or factory floors on a single-GPU workstation. No rack-scale infrastructure required. Scale by adding more single-GPU nodes behind a load balancer, not by scaling up individual nodes.
Limitations and Honest Assessment
No benchmark report is complete without an honest discussion of limitations — both the model's and our own methodology's.
Reasoning Is the Weakest Link
At 8.25/10, reasoning is the only category where Gemma 4 31B scored below 9. This is not surprising for a 31B dense model. Complex multi-step reasoning (chain-of-thought, mathematical proofs, logic puzzles) has historically required either much larger models or specialized architectures like OpenAI's o1 or DeepSeek R1. If your workload is reasoning-heavy, Gemma 4 31B is likely not the right choice. Consider a larger model or a reasoning specialist.
Self-Judging Inflates Scores
We emphasize this again because it is important. Our MT-Bench score of 9.73 uses the model as its own judge. Independent judging by GPT-4 or a human panel would likely produce lower scores. The category rankings (reasoning lowest, coding/extraction/writing highest) are more reliable than the absolute numbers. Use the scores for relative comparison across categories, not as ground truth quality metrics.
Dense Architecture Tradeoffs
Gemma 4 31B is a dense model. Every token activates all 31 billion parameters. An MoE model at the same capability level might activate only 8-12 billion parameters per token while having 100B+ total parameters. This means Gemma 4 31B has a higher per-token FLOP cost than an equivalently capable MoE model. We will explore this tradeoff in depth in Part 2 of this series, where we benchmark Gemma 4 against MoE competitors.
Context Window
The 8,192-token context window is adequate for conversational workloads and short document processing but insufficient for long-document analysis, multi-document summarization, or repository-scale code understanding. If you need 32K+ context, look elsewhere.
Benchmark Scope
We tested on H100 SXM GPUs only. Performance on A100, L40S, H200, or consumer GPUs (RTX 4090) will differ. We tested with vLLM only; other serving engines (TensorRT-LLM, SGLang, text-generation-inference) may yield different throughput numbers. Our workload shapes are representative of common patterns but cannot cover every possible deployment scenario.
How to Reproduce
We believe benchmarks should be reproducible. Here is enough to get you started:
1. Serve the Model
docker run --gpus all \
  -p 8000:8000 \
  vllm/vllm-openai:latest \
  --model google/gemma-4-31B-it \
  --dtype bfloat16 \
  --max-model-len 8192 \
  --tensor-parallel-size 1 \
  --port 8000
2. Benchmark Scripts
Our test suite consists of four scripts:
bench_throughput.py— ISL/OSL/concurrency sweep (240 data points)bench_inferencemax.py— Concurrency ramp to find maximum sustainable throughputbench_mtbench.py— MT-Bench multi-turn quality evaluationbench_pareto.py— Cross-GPU Pareto frontier analysis
Each script uses async HTTP requests to the vLLM OpenAI-compatible endpoint, measures server-side token timestamps via SSE, and outputs structured JSON results suitable for visualization.
To request the full benchmark scripts, contact us at inferencebench.io/support. We will provide the scripts along with Docker Compose configurations for reproducible multi-GPU setups.
For GPU sizing recommendations based on your specific workload, use the InferenceBench Workload Matcher, which takes your ISL, OSL, concurrency requirements, and budget to recommend the optimal GPU configuration.
Conclusion
Gemma 4 31B is a remarkable achievement in the open-weight model space. Google DeepMind has produced a 31-billion parameter dense transformer that delivers near-perfect quality scores across 6 of 8 MT-Bench categories, sustains 1,260 tok/s on a single H100, and fits comfortably in 62 GB of VRAM without quantization.
The key findings from our benchmark:
- Throughput: 855-1,260 tok/s on a single H100 depending on workload shape. Up to 3,050 tok/s at 8 GPUs, but at severe efficiency loss.
- Latency: 279ms TTFT on 1 GPU (ISL=128), dropping to 85ms on 8 GPUs. Prefill latency scales well with tensor parallelism.
- Quality: 9.73/10 MT-Bench (self-judged). Perfect scores in coding, extraction, humanities, math, roleplay, and writing. Reasoning at 8.25 is the weakest category.
- Scaling: Do NOT use tensor parallelism for throughput. Deploy single-GPU instances and scale horizontally. TP=8 wastes 78% of your GPU budget.
- Economics: $0.55/M tokens at Lambda pricing. 5-10x cheaper than frontier API models for self-hosted deployment.
The deployment recommendation is clear: one H100 per instance, horizontal scaling via load balancer, and reserve multi-GPU configurations only for latency-critical applications where sub-100ms TTFT justifies the efficiency penalty.
Coming in Part 2: We pit Gemma 4 31B against MoE competitors at similar capability levels. When every token activates 31B parameters vs. 8B active parameters in a sparse model, what happens to throughput, latency, and cost? The dense-vs-sparse showdown is the central question of modern inference economics, and we have the data to settle it.
Explore GPU costs for Gemma 4 31B and 160 other models at inferencebench.io/calculator. Compare configurations across 19 providers at inferencebench.io/compare. And size your deployment with the Workload Matcher.
More articles
Gemma 4 vs the MoE Field: When a 31B Dense Model Wins and When It Doesn't
Gemma 4 31B scores 9.73/10 MT-Bench from 31B dense params. We compare it against Mixtral 8x22B and DeepSeek V3 on cost, latency, and quality tradeoffs.
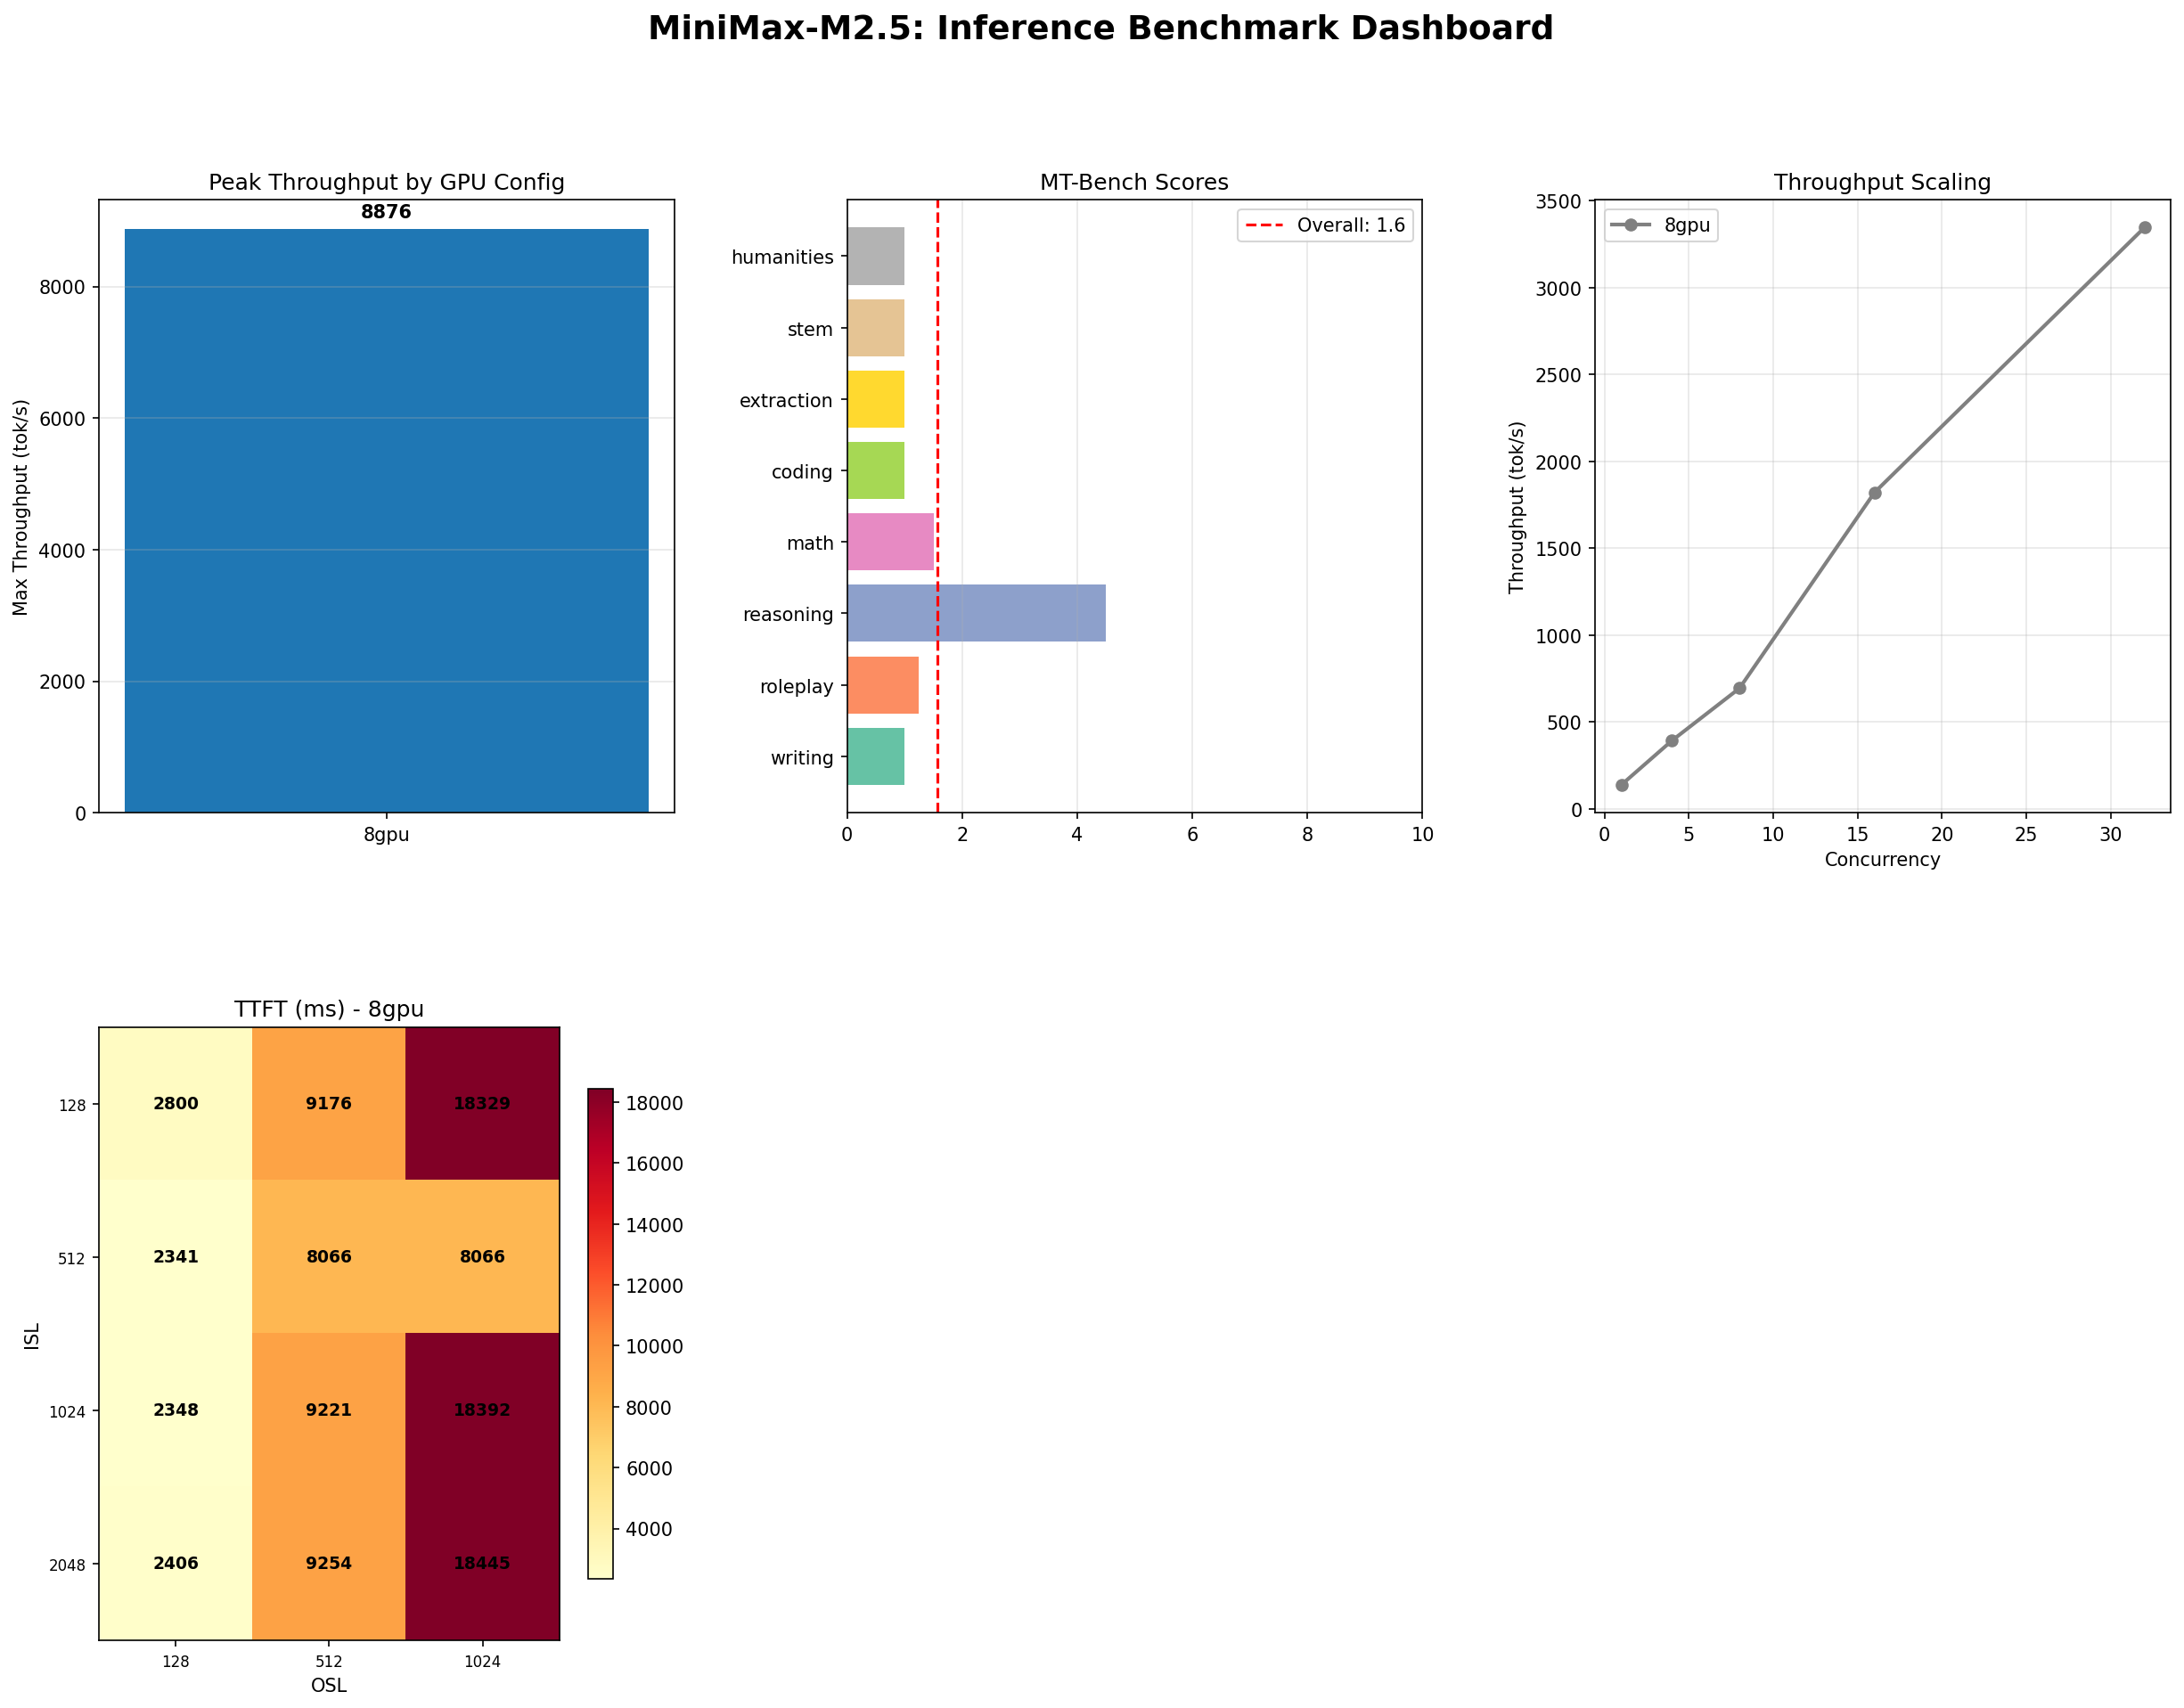
MiniMax M2.5: A 229B MoE Model That Defies Easy Judgment
MiniMax M2.5 229B MoE benchmarked on 8x H100: 8,876 tok/s peak, 100% needle-in-haystack, 87% tool use, but 1.57/10 MT-Bench. The full contradictory picture.
NVIDIA Rubin and Vera: The Next GPU Revolution for AI Infrastructure
NVIDIA Rubin brings HBM4, NVLink 6, and 2x Blackwell performance. Paired with the Vera ARM CPU, it reshapes AI inference economics for every cloud and datacenter operator.