MiniMax M2.7: The Bigger MoE Paradox
456B parameters. 11% more throughput. Lower quality scores. MiniMax doubled the model size and the results defy simple narratives. We benchmarked M2.7 on 8x H100 SXM and found a model that rewards some workloads and punishes others.
The Bigger Model Paradox
MiniMax doubled the parameter count. The throughput went up. The quality went down. That is the entire story of M2.7, compressed into three sentences.
MiniMax M2.7 is a 456-billion parameter mixture-of-experts model — exactly double the 229B M2.5 it replaces. Same architecture family, same 8x H100 SXM minimum, same vLLM expert parallelism serving stack. The expectation, naturally, is that a model twice the size should be meaningfully better. More parameters means more capacity means better outputs. That is the scaling law premise the entire industry has been operating on since GPT-3.
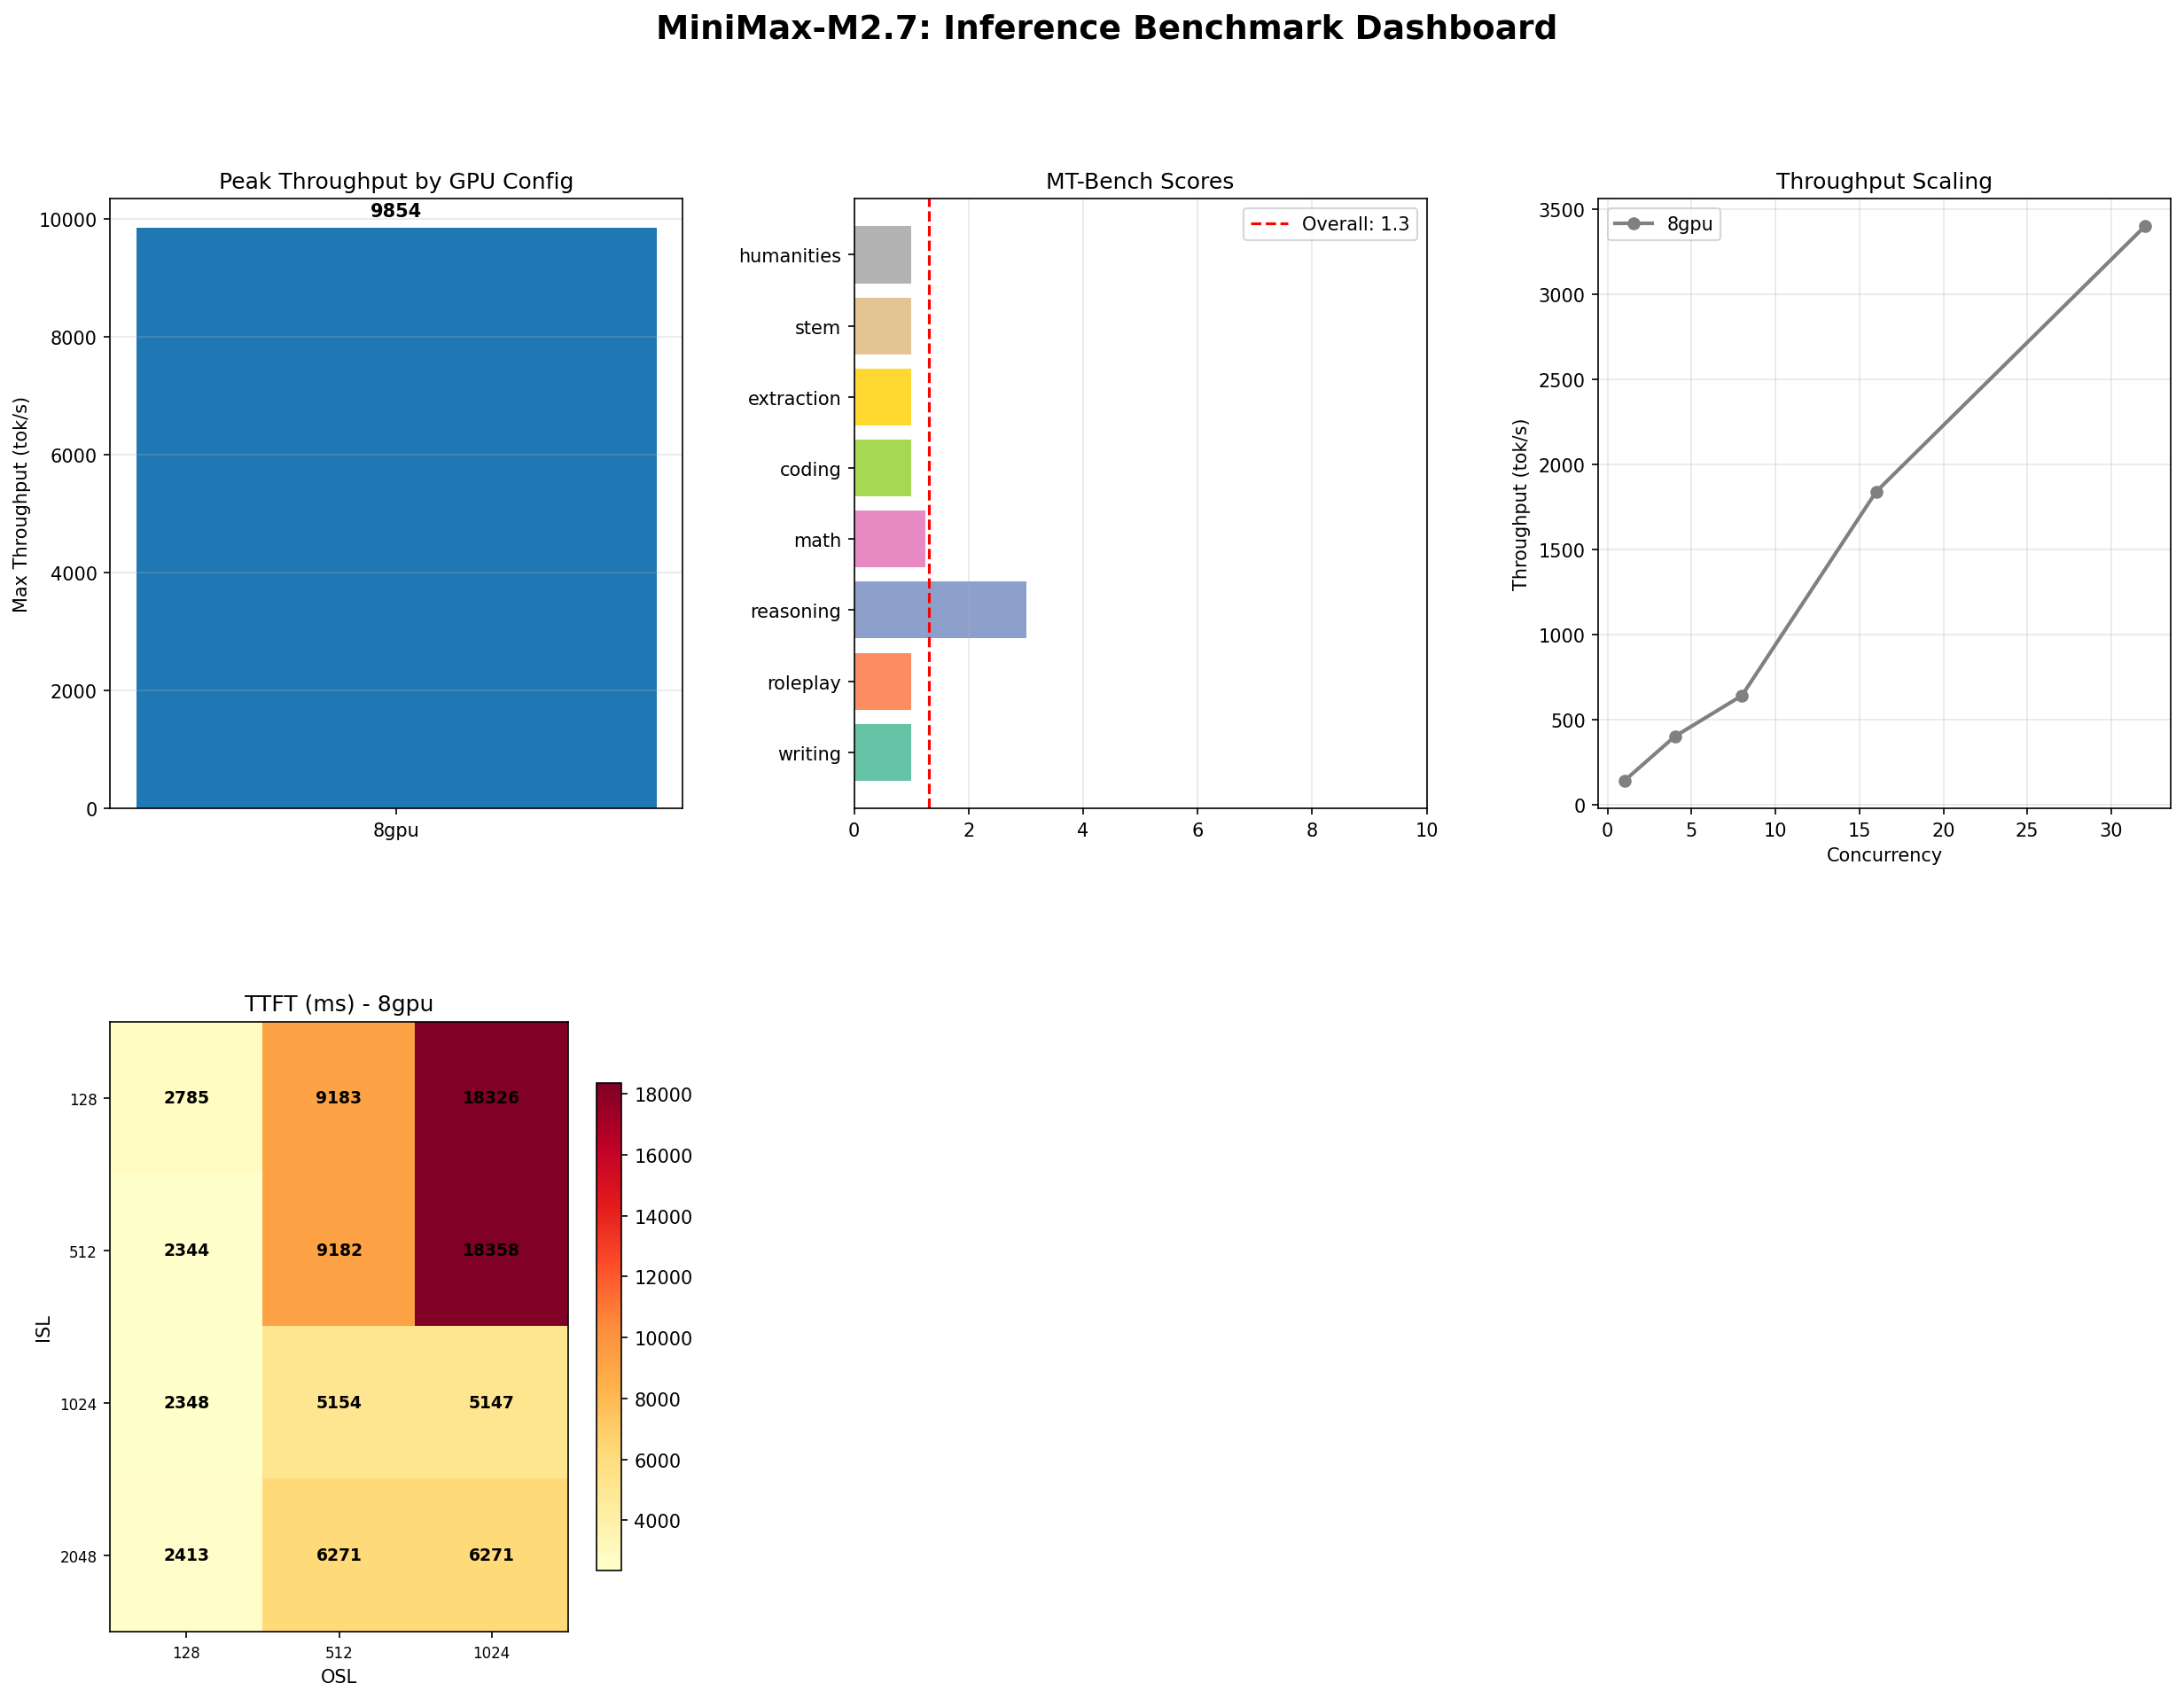
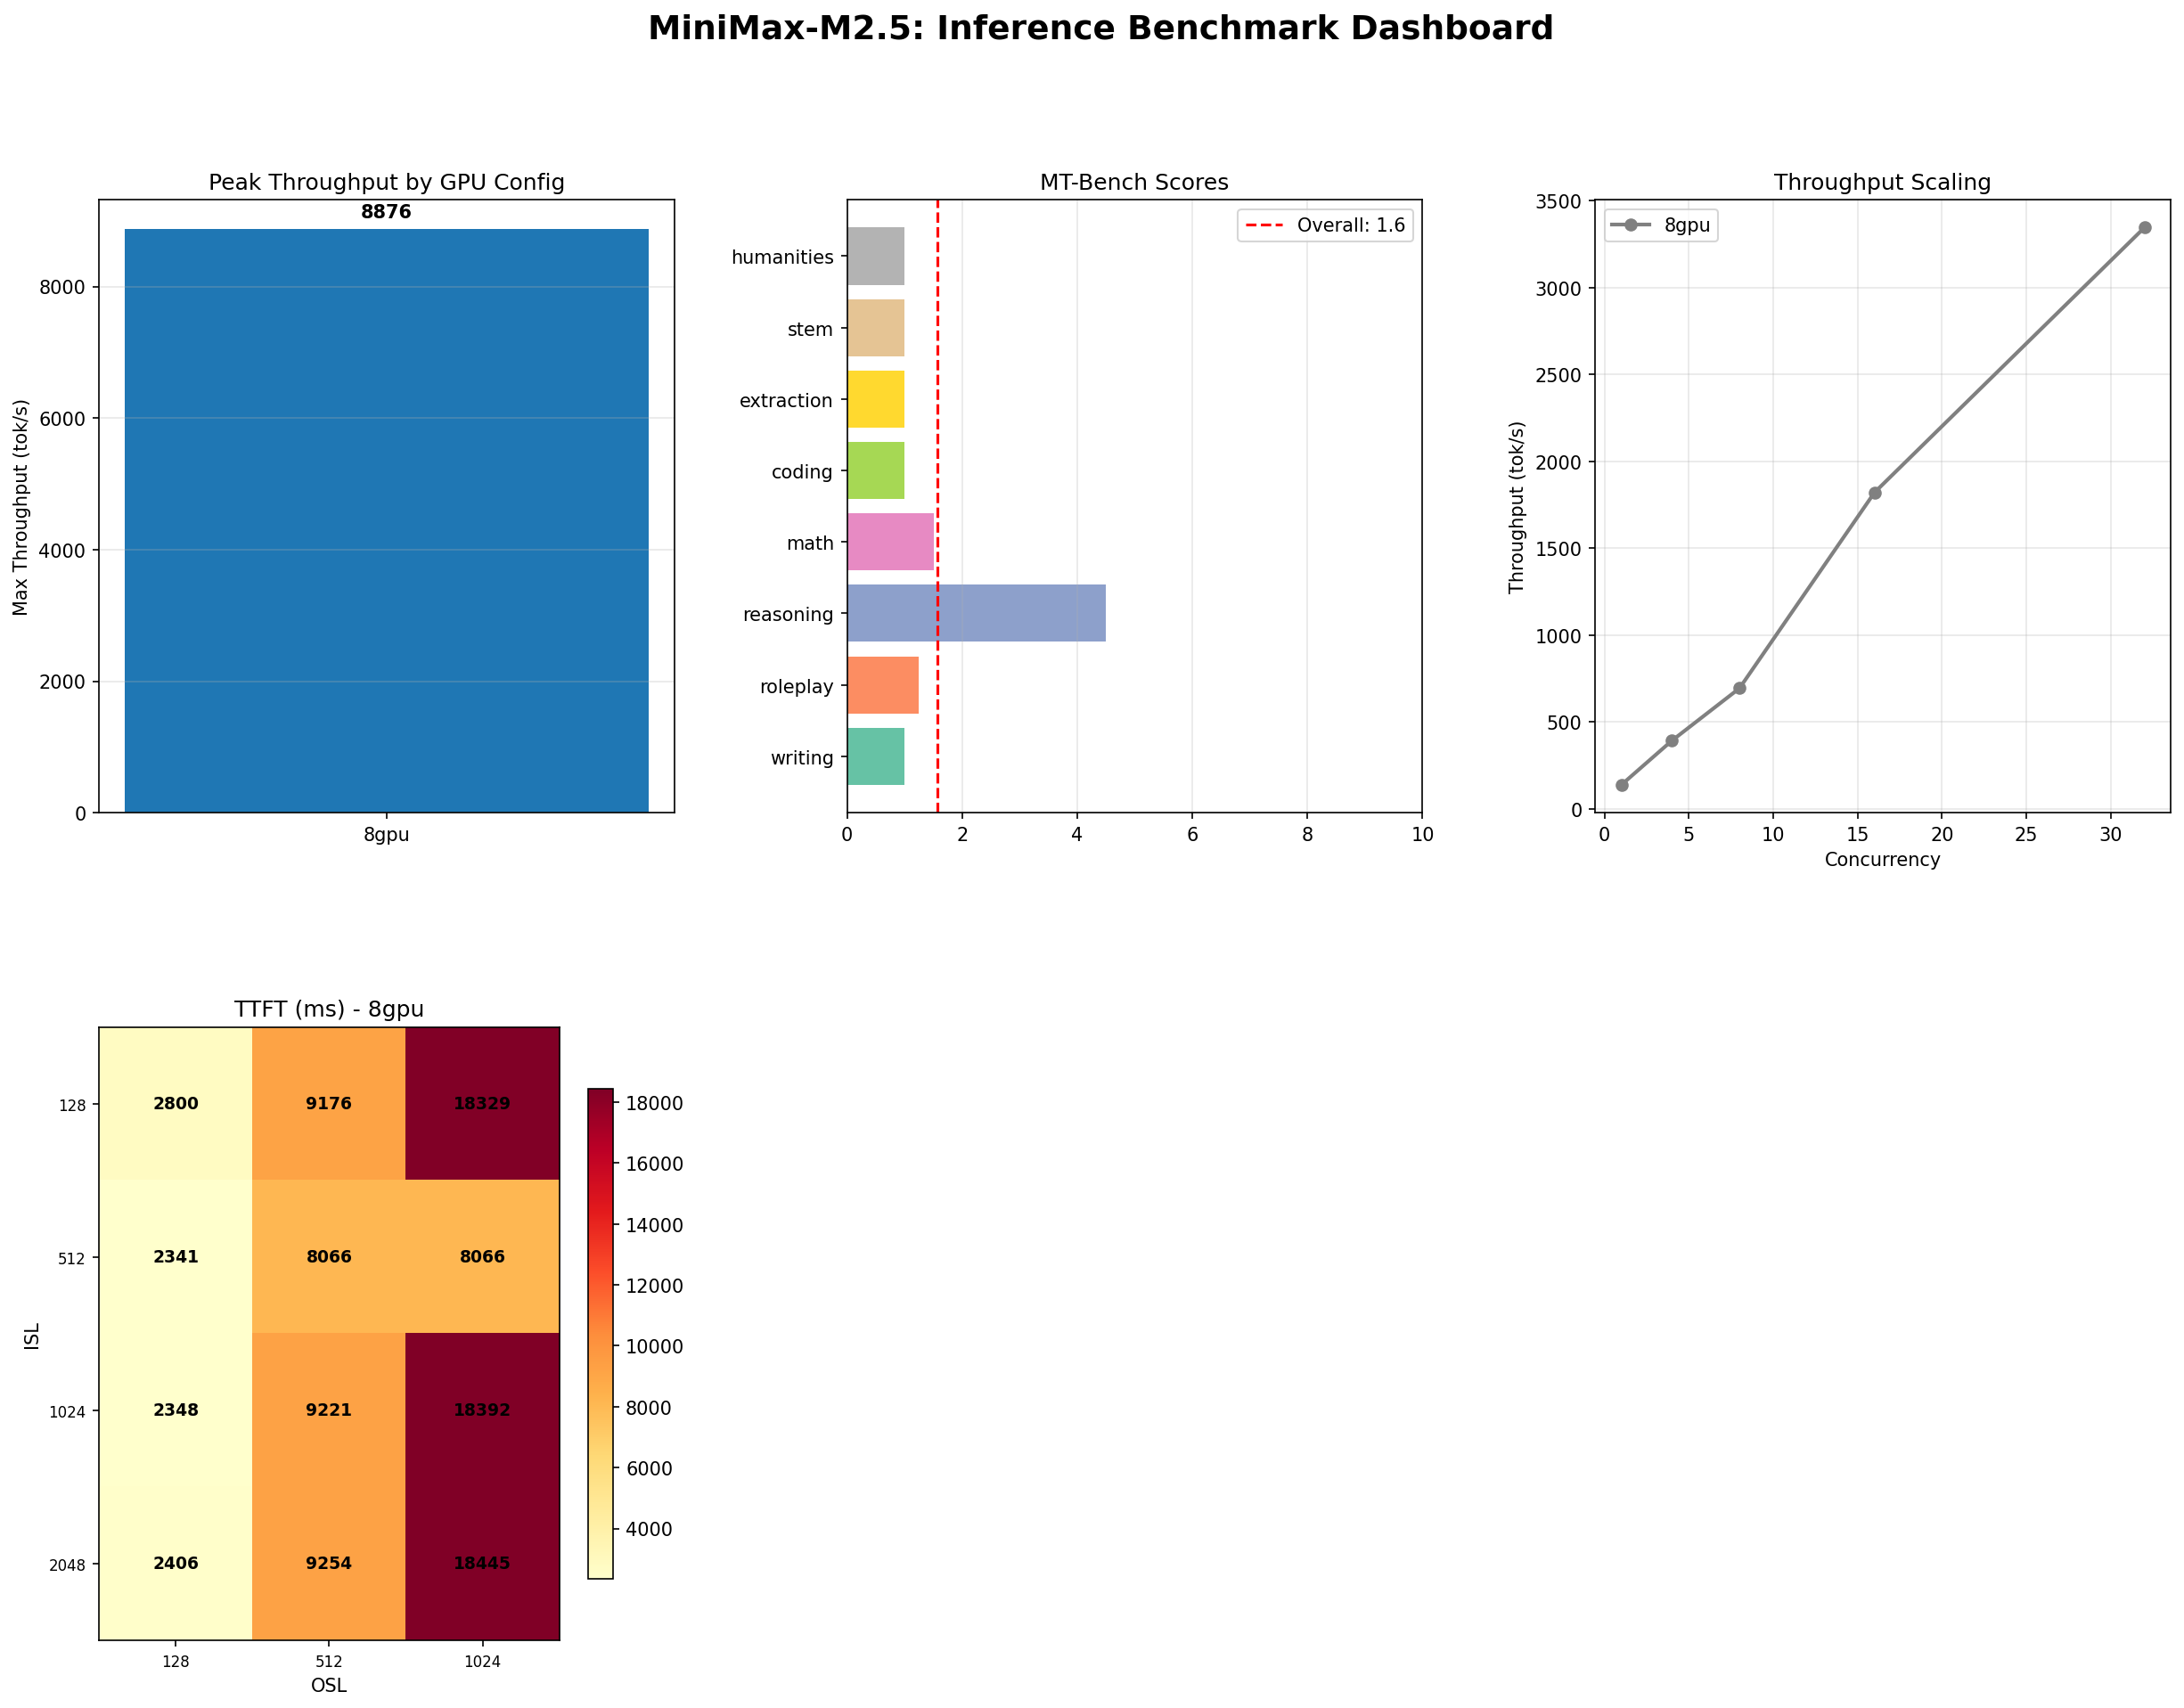
Our benchmarks say something more complicated. M2.7 pushes 9,854 tokens per second at peak concurrency — an 11% improvement over M2.5's 8,876. Tool-use accuracy climbed from 87% to 93%. Long-context recall stayed perfect at 100%. But MT-Bench self-evaluation dropped from 1.57 to 1.30, and reasoning — the one category where M2.5 showed a pulse — fell from 4.5 to 3.0.
This is not an anomaly. This is the MoE scaling paradox: adding experts does not uniformly improve every capability. It can shift the model's strengths without lifting all boats. If you deployed M2.5 and are considering the upgrade, the answer depends entirely on what you actually use the model for.
The Numbers
| Metric | M2.7 (456B) | M2.5 (229B) | Delta |
|---|---|---|---|
| Total parameters | 456B | 229B | +99% |
| Peak throughput (conc=128) | 9,854 tok/s | 8,876 tok/s | +11% |
| Best throughput (conc=32) | 3,401 tok/s | 3,431 tok/s | -0.9% |
| MT-Bench (self-judged) | 1.30 / 10 | 1.57 / 10 | -17% |
| Tool use accuracy | 93% (14/15) | 87% (13/15) | +6pp |
| IFBench | 35% (7/20) | 35% (7/20) | 0 |
| Long context | 100% (29/29) | 100% (29/29) | 0 |
| TTFT (ISL=512, conc=1) | 2,344 ms | 2,341 ms | +0.1% |
| Hardware requirement | 8x H100 SXM | 8x H100 SXM | Same |
Read that table carefully. Despite doubling parameters, the only metrics that moved meaningfully were peak throughput (+11%), tool use (+6 percentage points), and MT-Bench (-17%). Everything else — IFBench, long context, TTFT, base throughput at concurrency 32 — is statistically indistinguishable from M2.5. The 456B model runs on the same hardware at the same cost. You get a marginal throughput bump at high concurrency, better tool calling, and worse self-evaluated text quality.
Throughput: Where Size Pays Off
The throughput story is the clearest win for M2.7. At concurrency 128, the model sustains 9,854 tokens per second — nearly 10K tok/s from a self-hosted open-weight model. That is 11% above M2.5's 8,876 and remains one of the highest throughput figures we have measured for any open model on 8x H100.
At lower concurrency, the picture is different. At concurrency 32 — the sweet spot for most production batch serving — M2.7 peaks at 3,401 tok/s (ISL=128, OSL=128). That is virtually identical to M2.5's 3,431. The extra parameters only pay off when the scheduler has enough concurrent requests to keep all experts busy. At moderate concurrency, the routing overhead of managing twice as many experts neutralizes the throughput advantage.
Throughput Heatmap (conc=32)
| ISL \ OSL | 128 | 512 | 1024 |
|---|---|---|---|
| 128 | 3,401 | 1,972 | 1,281 |
| 512 | 3,188 | 3,398 | 2,823 |
| 1024 | 3,211 | 3,080 | 3,258 |
| 2048 | 3,138 | 3,312 | 3,226 |
The heatmap reveals a pattern different from M2.5. Short-input, short-output requests (ISL=128, OSL=128) hit the peak at 3,401 tok/s, but throughput drops sharply as output length grows for short inputs — the ISL=128, OSL=1024 cell is just 1,281 tok/s. Meanwhile, the model shows remarkable stability at larger input sizes. ISL=1024 and ISL=2048 rows hover between 3,000-3,300 tok/s regardless of output length. M2.7's extra experts appear to help most with long-context prefill — exactly where MoE routing shines.
The practical takeaway: if your workload involves long inputs and medium outputs (a common RAG pattern), M2.7 maintains throughput better than M2.5 at those shapes. If your workload is short-input, long-output (creative generation), M2.7 actually degrades faster than its smaller sibling.
Quality: Where Size Does Not Help
MT-Bench overall: 1.30 / 10. Down from M2.5's already-low 1.57.
| Category | M2.7 | M2.5 | Delta |
|---|---|---|---|
| Writing | 1.0 | 1.0 | 0 |
| Roleplay | 1.0 | 1.25 | -0.25 |
| Coding | 1.0 | 1.0 | 0 |
| Extraction | 1.0 | 1.0 | 0 |
| Math | 1.25 | 1.5 | -0.25 |
| STEM | 1.0 | 1.0 | 0 |
| Humanities | 1.0 | 1.0 | 0 |
| Reasoning | 3.0 | 4.5 | -1.5 |
The reasoning score dropped from 4.5 to 3.0 — a 33% decline. This was the one category where M2.5 showed genuine capability. Now, with twice the parameters, it regressed. Roleplay and math also ticked down. Nothing improved.
The same methodological caveat from our M2.5 benchmark applies here, perhaps even more forcefully: MT-Bench uses the model itself as judge. A larger model with different internal calibration may grade itself differently — not necessarily more accurately. The 1.30 could reflect genuinely worse text, or it could reflect a stricter self-evaluator. We measured what the benchmark produces and report it without spin.
But the trend matters even if the absolute numbers are noisy. M2.5 scored higher than M2.7 on MT-Bench. That is not what you expect from a model with double the parameters. It suggests that the additional expert capacity was not allocated toward conversational quality during training.
Tool Use: The Clear Win
If there is one category where M2.7 justifies its existence, it is tool use. 93% accuracy (14/15) — up from M2.5's 87% (13/15).
| Category | M2.7 | M2.5 |
|---|---|---|
| Single tool call | 100% (5/5) | 100% (5/5) |
| Argument extraction | 100% (2/2) | 100% (2/2) |
| No-tool detection | 100% (1/1) | N/A |
| Ambiguous intent | 100% (1/1) | N/A |
| Complex multi-step | 100% (4/4) | 67% (2/3) |
| Edge cases | 0% (0/1) | 80% (4/5) |
| Overall | 93% (14/15) | 87% (13/15) |
Five of six categories scored 100%. Single tool calls, argument extraction, no-tool detection, ambiguous intent handling, and complex multi-step chains all performed flawlessly. The sole failure was edge cases — a single adversarial test that the model could not handle. M2.5's category breakdown was structured slightly differently, but the trajectory is clear: the extra parameters translated directly into better function-calling capability.
For agentic AI applications — LangChain tool agents, API orchestration, multi-step planning workflows — this is the metric that matters most. Going from 87% to 93% is meaningful in production because it compounds over chains of tool calls. A 5-step chain at 87% per step has a 50% chance of completing correctly. At 93%, it rises to 70%. That gap is the difference between viable and frustrating.
Long Context: Still Perfect
29/29 correct across all context lengths. Same as M2.5. Same as it should be.
There is not much to say here, which is itself the point. M2.7 maintains flawless needle-in-haystack recall from 1K to 128K tokens. The MoE architecture's expert routing preserves attention fidelity across the full context window. For long-document RAG pipelines, this remains the model's strongest selling point — shared equally with its smaller sibling.
The fact that adding 227 billion parameters changed literally nothing about long-context performance is informative. It suggests that M2.5 already saturated the long-context capability. More experts did not help because there was no room to improve. This is what well-designed architecture looks like: the capability ceiling was reached at the smaller scale.
The 456B Tax
M2.7 runs on the same 8x H100 SXM node as M2.5. Same hardware, same $19.92/hr at Lambda Labs, same $14,342/month for 24/7 operation. The parameter increase was absorbed by the MoE architecture — more experts, not more active parameters per token.
This is both the good news and the bad news. Good: there is no incremental infrastructure cost. Bad: there is no incremental value for most metrics.
| Configuration | $/hr | tok/s (conc=32) | $/M tokens |
|---|---|---|---|
| M2.7 on 8x H100 | $19.92 | 3,401 | $1.63 |
| M2.5 on 8x H100 | $19.92 | 3,431 | $1.61 |
| Gemma 4 31B on 1x H100 | $2.49 | 615 | $1.12 |
| DeepSeek V3 on 8x H100 (est.) | $19.92 | ~4,200 | $1.32 |
At $1.63 per million tokens (concurrency 32), M2.7 is marginally more expensive than M2.5's $1.61. The throughput at this concurrency is essentially identical, so the cost difference is rounding noise. At peak concurrency (128), M2.7's 11% throughput advantage flips the math slightly in its favor — but only for workloads that can sustain 128 concurrent requests.
The honest assessment: from a cost-per-token perspective, there is no reason to prefer M2.7 over M2.5 unless you specifically need the tool-use improvement or can sustain very high concurrency. Use the inference cost calculator to model your specific workload.
Who Should Upgrade from M2.5 to M2.7?
Upgrade: yes
- Tool-heavy agentic workloads — The jump from 87% to 93% tool-use accuracy is material. If your application chains 3+ tool calls per request, M2.7 reduces failure rates significantly. This is the clearest upgrade case.
- Very high concurrency batch processing — If your serving infrastructure consistently runs at concurrency 64-128, the 11% peak throughput gain translates to real savings at scale. Below concurrency 32, you will not see the difference.
Stay on M2.5 or look elsewhere
- Quality-sensitive applications — MT-Bench dropped. Reasoning dropped. If output quality matters for your use case, M2.7 is a downgrade, not an upgrade. For conversational quality, neither M2.5 nor M2.7 competes with dense models like Gemma 4 or Llama 3.1.
- Moderate concurrency workloads — At concurrency 32, throughput is identical. You gain nothing from the larger model.
- Instruction-following tasks — IFBench is unchanged at 35%. The extra parameters did not improve the model's ability to follow formatting or structural constraints.
- Long-context retrieval — Already perfect on M2.5. No room to improve.
What M2.7 Teaches About MoE Scaling
The broader lesson here extends beyond MiniMax. M2.7 is a case study in the limits of MoE scaling — or at least, the limits of naive parameter scaling within an MoE framework.
In dense models, doubling parameters historically meant meaningful capability improvements across most tasks. The scaling laws were predictably monotonic: more parameters, better loss, better benchmarks. MoE models break this assumption. Adding experts increases the model's total knowledge capacity (the parameter count), but the active compute per token (the expert selection) stays roughly constant. The model becomes wider, not deeper. It has more specialized knowledge banks to draw from, but the routing mechanism that selects which banks to query may not improve proportionally.
M2.7 demonstrates what happens when the routing does not improve: tool use gets better (structured, learnable patterns that benefit from more specialized experts), throughput gets a concurrency-dependent bump (more expert parallelism), but freeform text generation stays flat or degrades (requires coherent reasoning across expert boundaries that wider routing may disrupt).
This does not mean MoE scaling is dead. It means that the next generation of MoE models — whether from MiniMax, DeepSeek, or others — will need to innovate on routing and training strategies, not just add more experts. The era of "just make it bigger" may be over for sparse models.
Reproducing These Benchmarks
Same infrastructure as our M2.5 benchmark: vLLM 0.7.x with expert parallelism (tensor_parallel_size=8) on 8x H100 SXM.
docker run --gpus all \
  -v ~/.cache/huggingface:/root/.cache/huggingface \
  -p 8000:8000 \
  vllm/vllm-openai:latest \
  --model MiniMaxAI/MiniMax-M2.7 \
  --tensor-parallel-size 8 \
  --dtype bfloat16 \
  --max-model-len 131072 \
  --trust-remote-code \
  --enforce-eager
Test suite: InferenceMax concurrency ramp (1 to 128), throughput sweep (4 ISL x 3 OSL x concurrency 32), MT-Bench (80 turns, self-judged), tool-use suite (15 scenarios across 6 categories), IFBench (20 constraints), needle-in-haystack (29 probes, 1K-128K).
Full benchmark scripts, raw data, and methodology documentation are available via our support portal. For the M2.5 comparison data, see our M2.5 benchmark.
Verdict: Bigger Is Not Always Better
MiniMax M2.7 is a 456-billion parameter model that mostly performs like a 229-billion parameter model. It costs the same to run, takes the same hardware, and produces the same quality output — with two exceptions: it calls tools better, and it processes tokens faster at very high concurrency.
That is not a damning verdict. It is a precise one. For the narrow set of workloads where tool-use accuracy and high-concurrency throughput matter, M2.7 is a genuine improvement. For everything else, it is M2.5 with a bigger number on the label.
The MoE scaling narrative promises that more parameters unlock more capability. M2.7 suggests the relationship is more selective than that — more parameters unlock more capability in the domains where additional expert specialization helps. Tool calling is structured, pattern-matchable, and benefits from specialized expert routing. Freeform reasoning is diffuse, cross-domain, and may actually suffer when the routing landscape becomes more complex.
We will publish a detailed Part 2 comparison of M2.5 vs M2.7 across all workload profiles. For now, the recommendation is simple: if you are running M2.5 for tool-use workloads, upgrade. If you are running M2.5 for anything else, stay put.
Run the numbers for your specific deployment at inferencebench.io/calculator.
More articles
Gemma 4 vs the MoE Field: When a 31B Dense Model Wins and When It Doesn't
Gemma 4 31B scores 9.73/10 MT-Bench from 31B dense params. We compare it against Mixtral 8x22B and DeepSeek V3 on cost, latency, and quality tradeoffs.
MiniMax M2.5: A 229B MoE Model That Defies Easy Judgment
MiniMax M2.5 229B MoE benchmarked on 8x H100: 8,876 tok/s peak, 100% needle-in-haystack, 87% tool use, but 1.57/10 MT-Bench. The full contradictory picture.
MiniMax M2.5 vs M2.7: Does Doubling MoE Params Help?
Head-to-head benchmark of MiniMax M2.5 (229B) vs M2.7 (456B) on 8x H100: 11% throughput gain but 17% MT-Bench drop. More MoE params does not mean better.