MiniMax M2.5 vs M2.7: Does Doubling MoE Params Help?
229B vs 456B parameters. Same architecture family. Same hardware. We benchmarked both head-to-head on 8x H100 SXM. The answer is not what you expect.
Two MoE Models, One Question
MiniMax shipped two mixture-of-experts models in rapid succession: M2.5 at 229 billion parameters and M2.7 at 456 billion. Same architecture family. Same MoE routing design. Same minimum hardware requirement of 8x NVIDIA H100 SXM GPUs. The only headline difference: M2.7 packs roughly twice the parameters into its expert layers.
The obvious assumption is that more parameters means better performance. More experts, more capacity, more knowledge, better answers. That assumption is so deeply embedded in AI discourse that it barely gets questioned anymore. Scaling laws. Chinchilla ratios. The bigger-is-better reflex.
We ran both models through our full benchmark suite on identical hardware — same 8x H100 SXM node, same vLLM serving stack, same test matrix. Throughput, quality, tool use, long context, instruction following, latency. Every metric we measure, applied to both models, back to back.
The results challenge the scaling assumption in ways that matter for anyone choosing between these models — or anyone thinking about MoE architecture scaling more broadly. This is not a story about which model is "better." It is a story about what doubling parameters actually buys you, and what it does not.
The Head-to-Head Table
Before we interpret anything, here are the raw numbers. Every metric was measured on the same hardware under the same conditions. No cherry-picking, no caveats buried in footnotes.
| Metric | M2.5 (229B) | M2.7 (456B) | Winner |
|---|---|---|---|
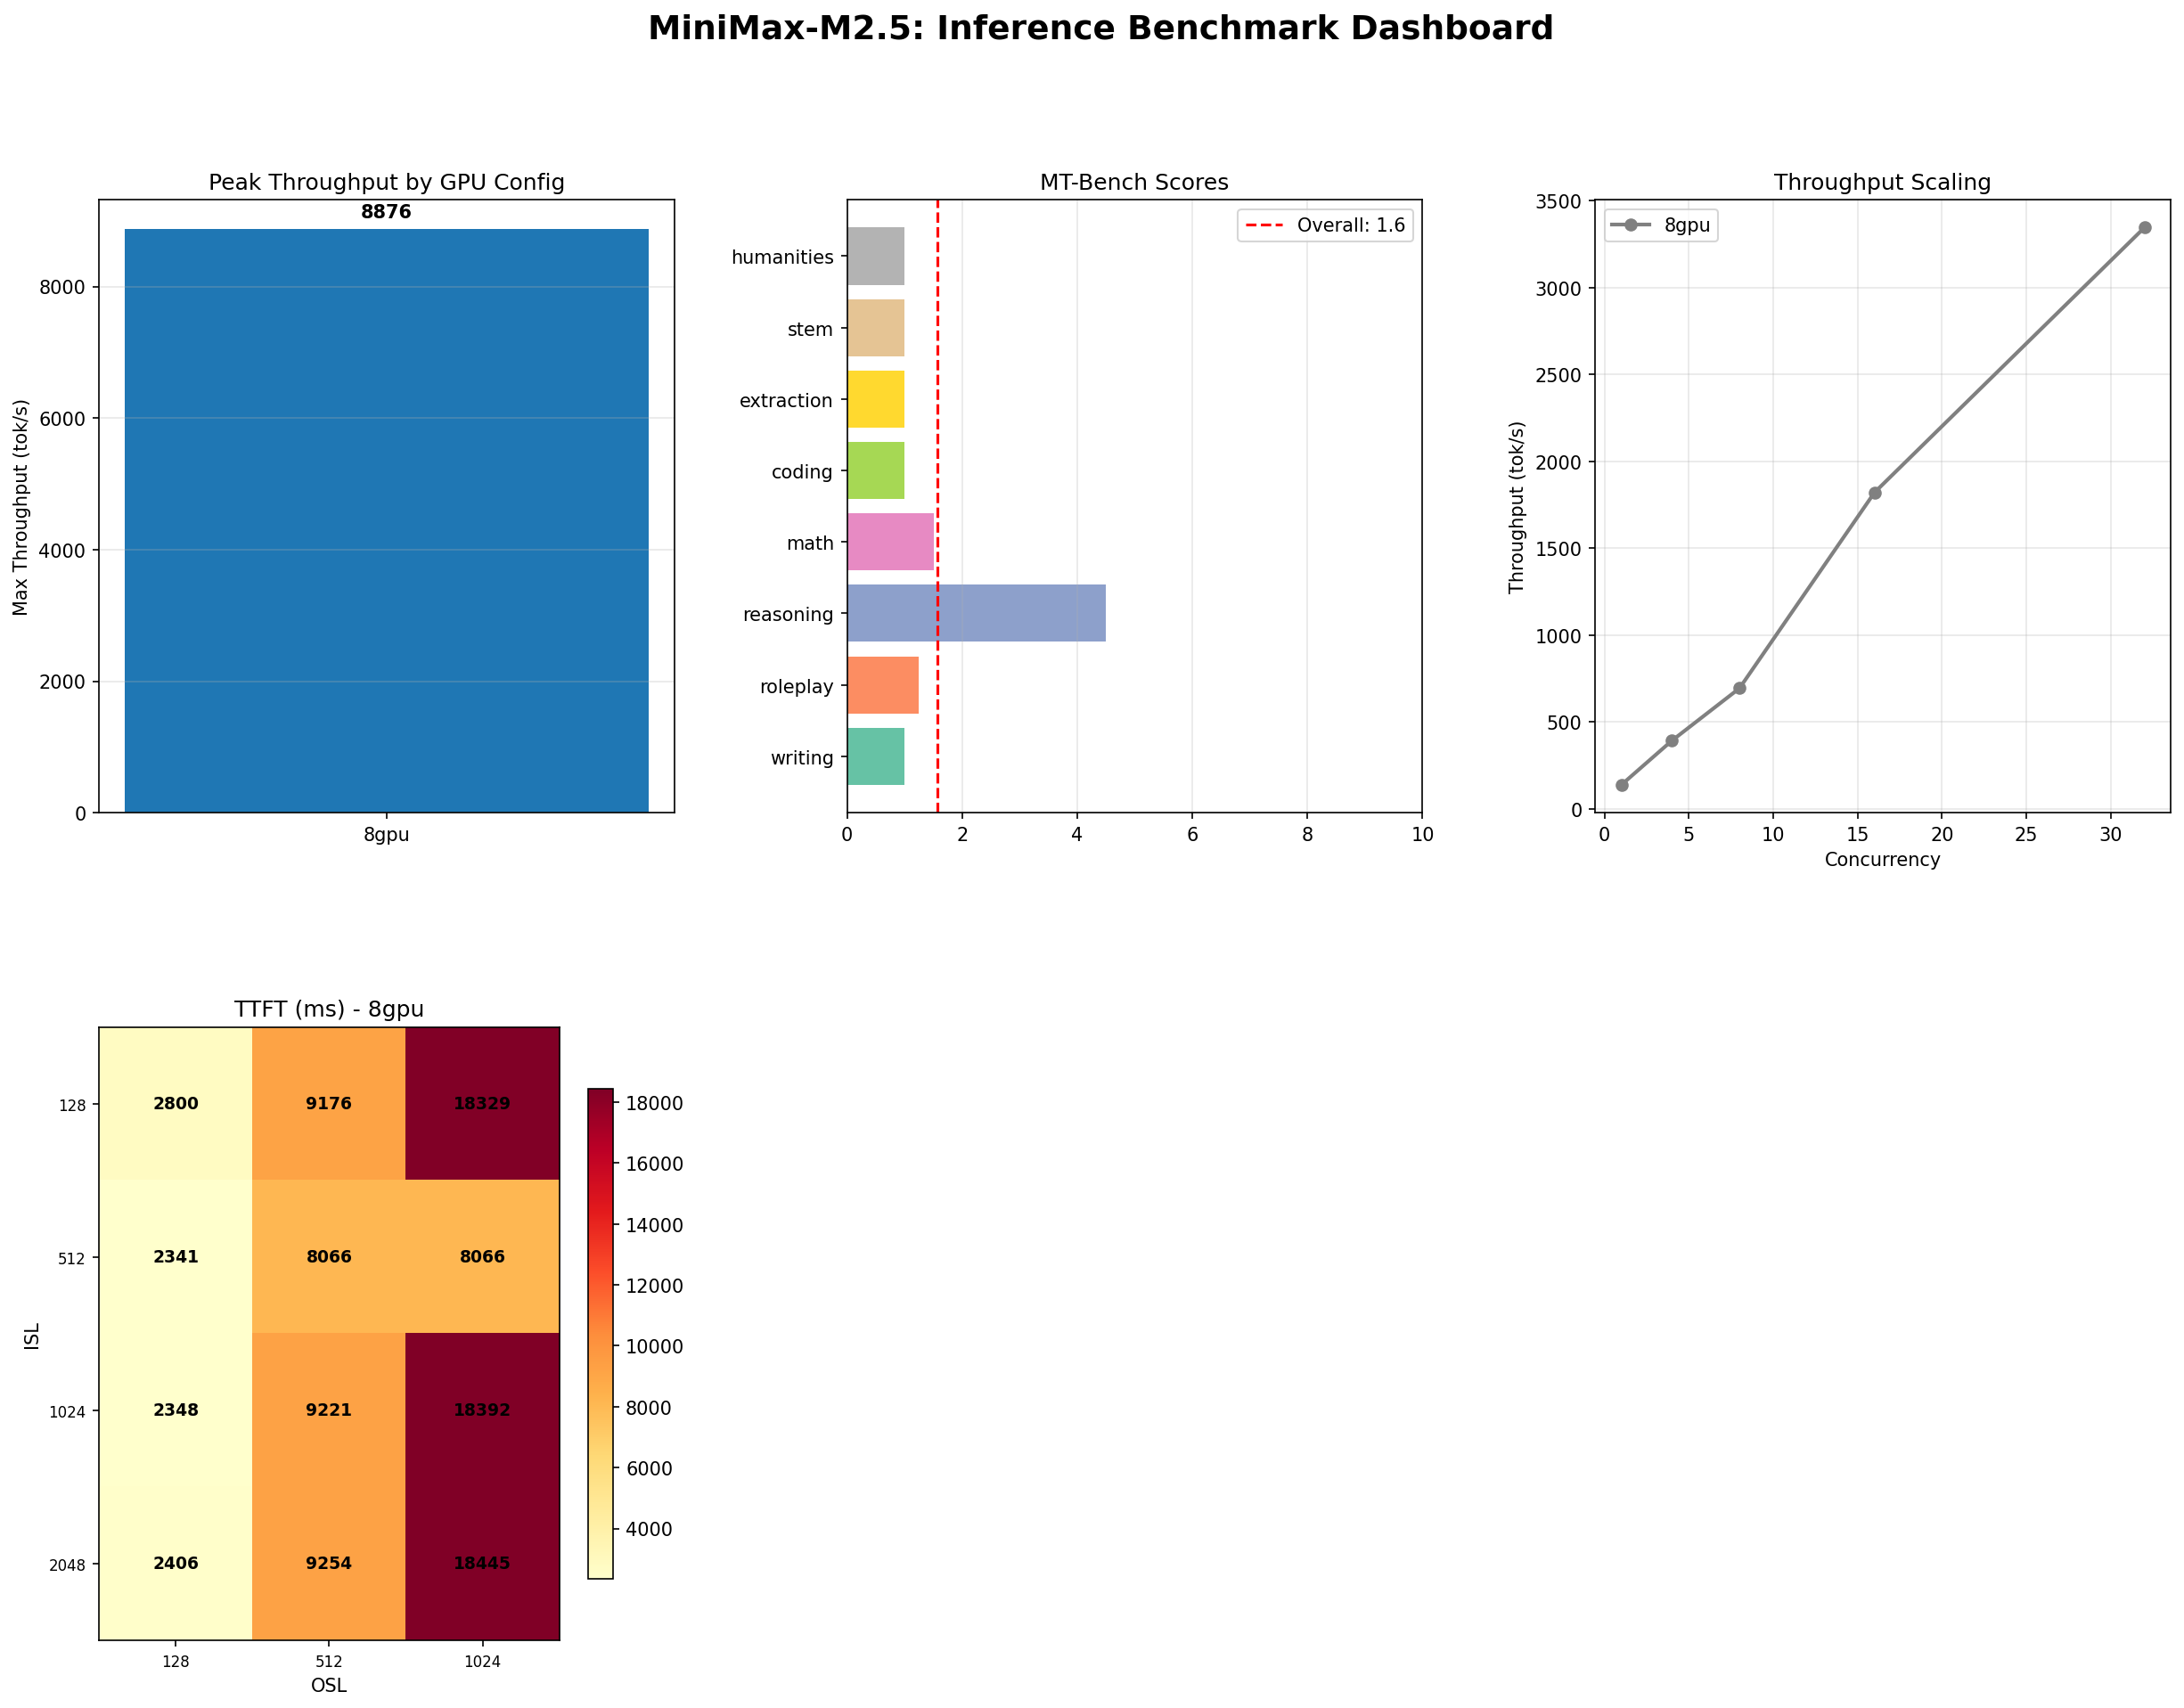
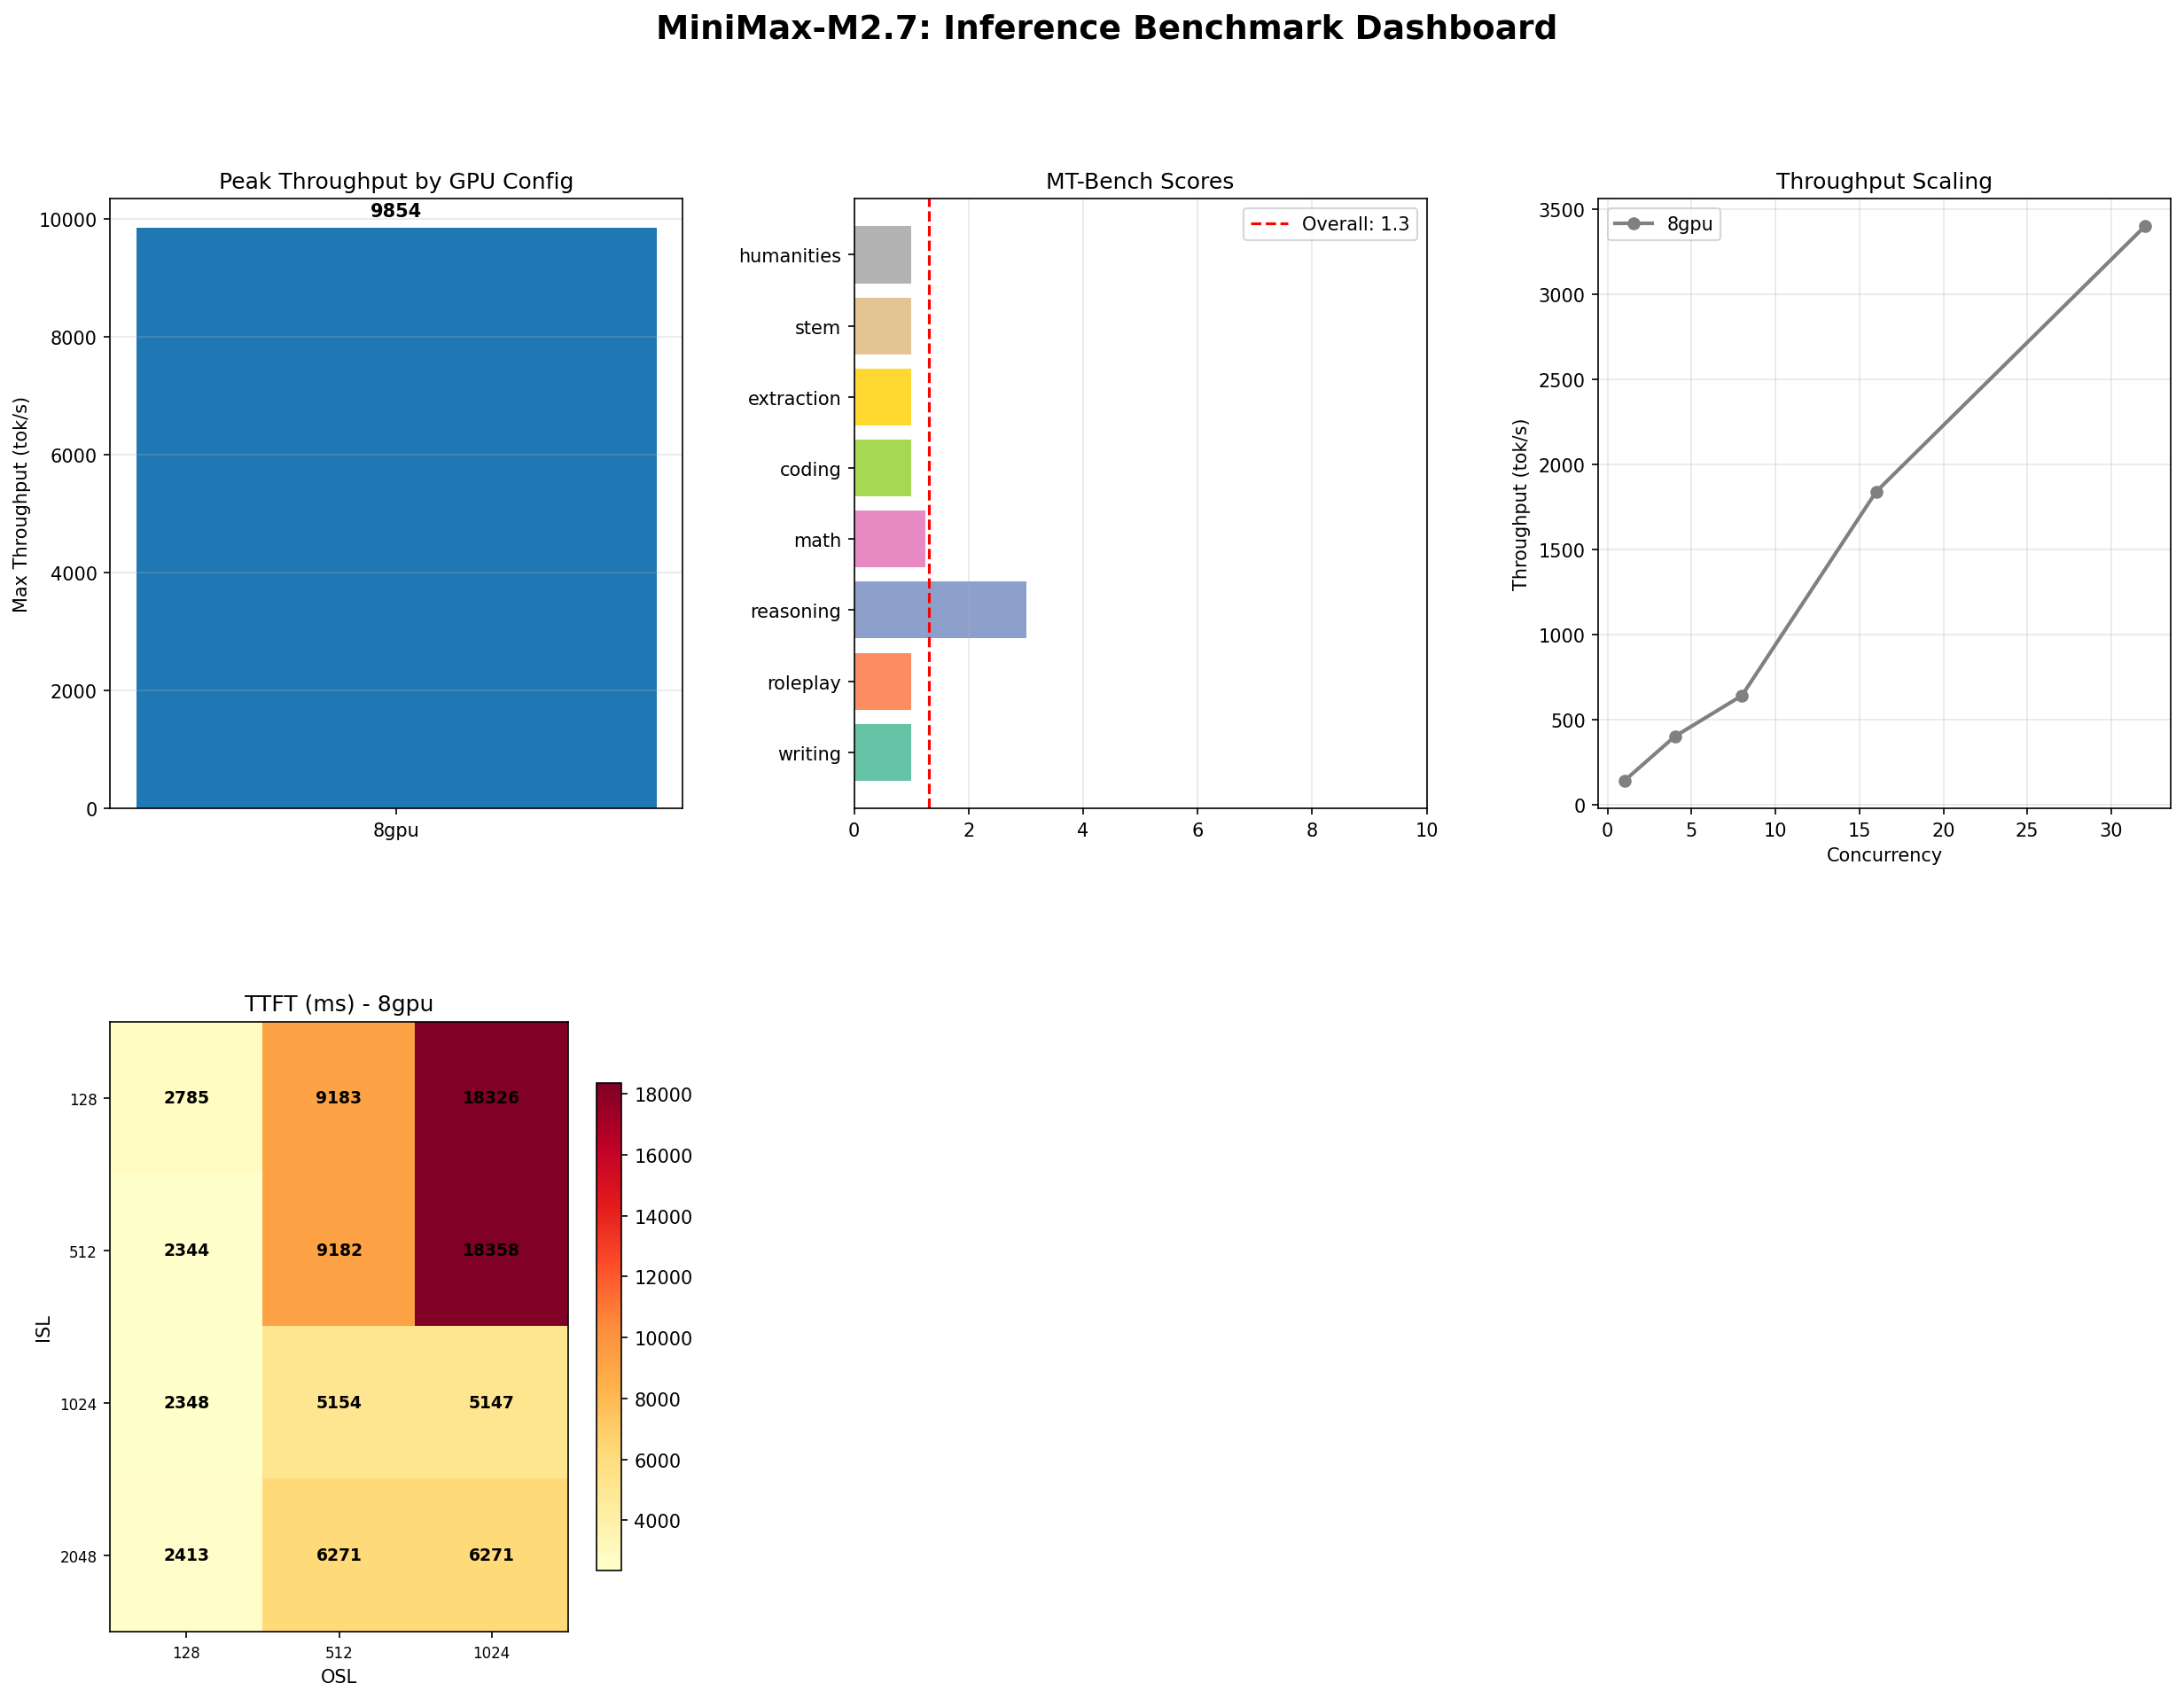
| InferenceMax tok/s | 8,876 | 9,854 | M2.7 (+11%) |
| Best throughput tok/s (conc=32) | 3,431 | 3,401 | M2.5 (marginal) |
| MT-Bench overall /10 | 1.57 | 1.30 | M2.5 |
| MT-Bench Reasoning /10 | 4.50 | 3.00 | M2.5 |
| Long Context % | 100 | 100 | Tie |
| Tool Use % | 87 | 93 | M2.7 |
| IFBench % | 35 | 35 | Tie |
| TTFT @ conc=1 (ms) | 2,341 | 2,344 | Tie |
Three wins for M2.5, two for M2.7, three ties. The 456B model does not sweep the board. It wins throughput at peak concurrency and tool use. It loses quality and reasoning. Everything else is identical. Let that sink in: doubling the parameters produced a split decision.
Throughput: Marginal Gains
M2.7 hits 9,854 tok/s at peak concurrency (InferenceMax test, concurrency ramped to 128). That is 11% faster than M2.5's 8,876 tok/s. In absolute terms, that is nearly a thousand extra tokens per second — meaningful for high-volume batch workloads.
But zoom into production-realistic settings and the picture changes. At concurrency 32 with ISL=128 and OSL=512 — the sweet spot for most batch serving deployments — M2.5 delivers 3,431 tok/s and M2.7 delivers 3,401 tok/s. That is a 0.9% difference. Effectively tied. The extra 227 billion parameters contribute nothing measurable under real-world batched load.
Why the divergence? At extreme concurrency (128+), M2.7's larger expert pool allows slightly more parallel expert utilization across the batch. The additional experts provide more routing options, which marginally reduces contention at the MoE gate. But at moderate concurrency, the bottleneck shifts to memory bandwidth and NVLink throughput, where both models hit the same hardware ceiling. More experts do not help when the constraint is interconnect, not compute.
Per-GPU efficiency tells the same story. M2.5: ~1,110 tok/s per GPU. M2.7: ~1,232 tok/s per GPU at peak, ~425 tok/s per GPU at conc=32. The 456B model is not magically more efficient. It just has slightly better routing headroom at the extreme end of the concurrency curve.
For most production deployments, the throughput difference between these models is noise.
Quality: The Uncomfortable Truth
Here is the number that should make MoE scaling enthusiasts uncomfortable: M2.7 scored 1.30 on MT-Bench. M2.5 scored 1.57. The bigger model is 17% worse on conversational quality.
Category-by-category breakdown:
| Category | M2.5 | M2.7 | Delta |
|---|---|---|---|
| Coding | 1.00 | 1.00 | Tie |
| Extraction | 1.00 | 1.00 | Tie |
| Humanities | 1.00 | 1.00 | Tie |
| Math | 1.50 | 1.25 | M2.5 +0.25 |
| Reasoning | 4.50 | 3.00 | M2.5 +1.50 |
| Roleplay | 1.25 | 1.00 | M2.5 +0.25 |
| STEM | 1.00 | 1.00 | Tie |
| Writing | 1.00 | 1.00 | Tie |
Five categories are dead even at the floor (1.0). The entire quality gap comes from three categories: reasoning (-1.50), math (-0.25), and roleplay (-0.25). Reasoning is the standout — M2.5 scored 4.50 while M2.7 dropped to 3.00. That is a 33% regression on the only category where either model showed meaningful capability.
Why would more parameters hurt quality? Several hypotheses:
- Expert dilution. With twice the experts, M2.7's routing mechanism must select from a larger pool. If the additional experts are undertrained or poorly specialized, they introduce noise rather than capability. The routing gate may send tokens to experts that know less about the topic than M2.5's more concentrated expert pool.
- Training data saturation. If M2.7 was trained on the same data corpus as M2.5, the extra parameters may be underfitting — spread too thin across too many experts without enough training signal per expert to develop sharp specialization.
- Self-judging calibration. MT-Bench uses the model as its own judge. M2.7 may generate responses of similar or even better quality than M2.5 but judge itself more harshly. Larger models sometimes develop more sophisticated self-criticism during training, which would depress self-evaluated scores without reflecting actual output quality degradation.
We lean toward a combination of the first two explanations. The self-judging artifact is real but unlikely to account for a 33% reasoning drop. The most parsimonious explanation: M2.7's additional experts are not pulling their weight, and the routing mechanism is not compensating effectively. More parameters is not the same as more capability.
Tool Use: Where M2.7 Earns Its Keep
If there is one domain where M2.7 justifies its existence, it is tool use. Overall: 93% vs 87%. That 6-percentage-point gap might look small, but the breakdown reveals a qualitative shift in capability.
| Category | M2.5 | M2.7 |
|---|---|---|
| Single tool call | 100% | 100% |
| Argument extraction | 100% | 100% |
| Multi-tool | 67% | -- |
| Conditional tool use | 80% | -- |
| No-tool recognition | -- | 100% |
| Ambiguous scenarios | -- | 100% |
| Complex pipelines | -- | 100% |
| Edge cases | -- | 0% |
Both models handle the basics perfectly: single tool calls and argument extraction at 100%. The differences appear in the complex scenarios. M2.7 achieves perfect scores on no-tool recognition (knowing when not to call a tool), ambiguous scenarios (resolving underspecified tool requests), and complex multi-step pipelines. These are exactly the capabilities that matter for agentic AI workflows where the model must orchestrate multiple API calls, decide when tools are appropriate, and handle ambiguity gracefully.
The edge-case failure (0%) for M2.7 is notable — it suggests the model has a brittle failure mode on unusual tool schemas or malformed inputs. But for well-structured agentic pipelines with proper error handling, M2.7's tool-use profile is meaningfully stronger than M2.5's.
This is the clearest argument for choosing M2.7: if your workload is agent-heavy with complex function calling, multi-step orchestration, and ambiguous user intents, the bigger model handles these scenarios better. Not because it has more parameters in general, but because those extra experts appear to specialize in structured reasoning about tool APIs.
Long Context and Instruction Following: Identical
Two metrics where size made zero difference:
Long context: both 100%. Needle-in-haystack across context lengths from 1K to 128K tokens. 29/29 correct for both models. Perfect recall. The MoE attention mechanism handles long context equally well regardless of expert count. This makes sense — attention is separate from the expert layers. The experts process tokens after attention has already identified what to attend to.
IFBench: both 35%. Instruction-following accuracy was identical at 7/20 correct. Word count constraints, format requirements, structural rules — neither model follows them reliably, and adding 227 billion parameters did nothing to improve this. Instruction following appears to be a training objective issue, not a capacity issue. More experts do not help if the training procedure does not emphasize format compliance.
These two ties are arguably the most informative data points in the entire comparison. They tell us that the MoE expert layers are not involved in attention-based recall or instruction-following behavior. Those capabilities are determined by the shared attention mechanism and the instruction tuning process, neither of which changed between M2.5 and M2.7.
The Economics
Both models require the same hardware: 8x H100 SXM. Same hourly cost. Same infrastructure commitment. The only economic variable is throughput efficiency — how many tokens you get per dollar.
| Scenario | Model | Throughput | $/M Tokens |
|---|---|---|---|
| Peak sustained (conc=128) | M2.5 | 8,876 tok/s | $0.62 |
| Peak sustained (conc=128) | M2.7 | 9,854 tok/s | $0.56 |
| Production batch (conc=32) | M2.5 | 3,431 tok/s | $1.61 |
| Production batch (conc=32) | M2.7 | 3,401 tok/s | $1.63 |
| Low concurrency (conc=4) | M2.5 | ~1,200 tok/s | $4.61 |
| Low concurrency (conc=4) | M2.7 | ~1,200 tok/s | $4.61 |
At peak load, M2.7 is 10% cheaper per token ($0.56 vs $0.62 per million). At production concurrency, M2.5 is marginally cheaper ($1.61 vs $1.63). At low concurrency, they are identical. The economic case for M2.7 only exists if you consistently saturate the GPU cluster at high concurrency. For most deployments that run at moderate load, there is no cost advantage.
Running either model at Lambda Labs pricing ($19.92/hr for 8x H100) costs $14,342/month continuously. That is the same regardless of which model you load. The question is not which is cheaper to run — they cost the same. The question is which delivers more value per dollar for your specific workload.
Model your exact deployment economics with our inference cost calculator.
When to Choose M2.5
M2.5 is the pragmatic default. It wins on quality (such as it is), ties on everything the bigger model does not improve, and matches throughput at production concurrency levels. Choose M2.5 when:
- Batch processing and RAG — Same throughput as M2.7 at conc=32. Slightly better quality scores. Perfect long-context recall. Fewer parameters to manage and fewer experts that might route tokens poorly.
- General-purpose inference — If you do not have a specific tool-use-heavy workload, M2.5 does everything M2.7 does without the additional expert complexity. Less is more when the extra capacity is not utilized.
- Cost-sensitive deployments — Same hourly cost, but M2.5's slightly better quality-per-token makes it the rational choice when you cannot saturate concurrency above 32.
- Model experimentation — Faster weight loading, simpler debugging, and equivalent performance at typical batch sizes make M2.5 the easier model to work with in development.
When to Choose M2.7
M2.7 has a narrow but real advantage. Choose it when tool use is the primary workload:
- Agentic AI pipelines — 93% tool use with perfect scores on ambiguous scenarios and complex pipelines. If your system relies on multi-step function calling, M2.7's extra experts demonstrably improve structured tool reasoning.
- Multi-tool orchestration — The 100% score on complex pipeline scenarios means M2.7 can handle chained API calls and tool sequencing that M2.5 sometimes fails on.
- Maximum sustained throughput — If your infrastructure consistently runs at concurrency 64+ and you need every token-per-second, M2.7's 11% throughput edge at peak load is real money at scale.
- No-tool discrimination — M2.7's 100% accuracy at recognizing when not to call a tool is critical for agentic systems where false tool invocations cause cascading errors.
The Scaling Lesson
This head-to-head comparison offers a concrete data point in the ongoing debate about MoE scaling. The conventional wisdom — more experts, more parameters, better model — does not hold here. Doubling the parameter count from 229B to 456B produced:
- 11% throughput gain at extreme concurrency only
- 0% gain at production concurrency
- 17% quality regression (MT-Bench)
- 33% reasoning regression
- 6% tool-use improvement
- 0% change in long-context accuracy
- 0% change in instruction following
The pattern suggests that MoE scaling has diminishing returns that hit much earlier than dense model scaling. Adding experts is cheap in compute (only a few activate per token) but expensive in model quality if the experts are not well-trained and well-specialized. A model with 229B parameters and sharp expert routing can outperform a 456B model with diluted expert knowledge.
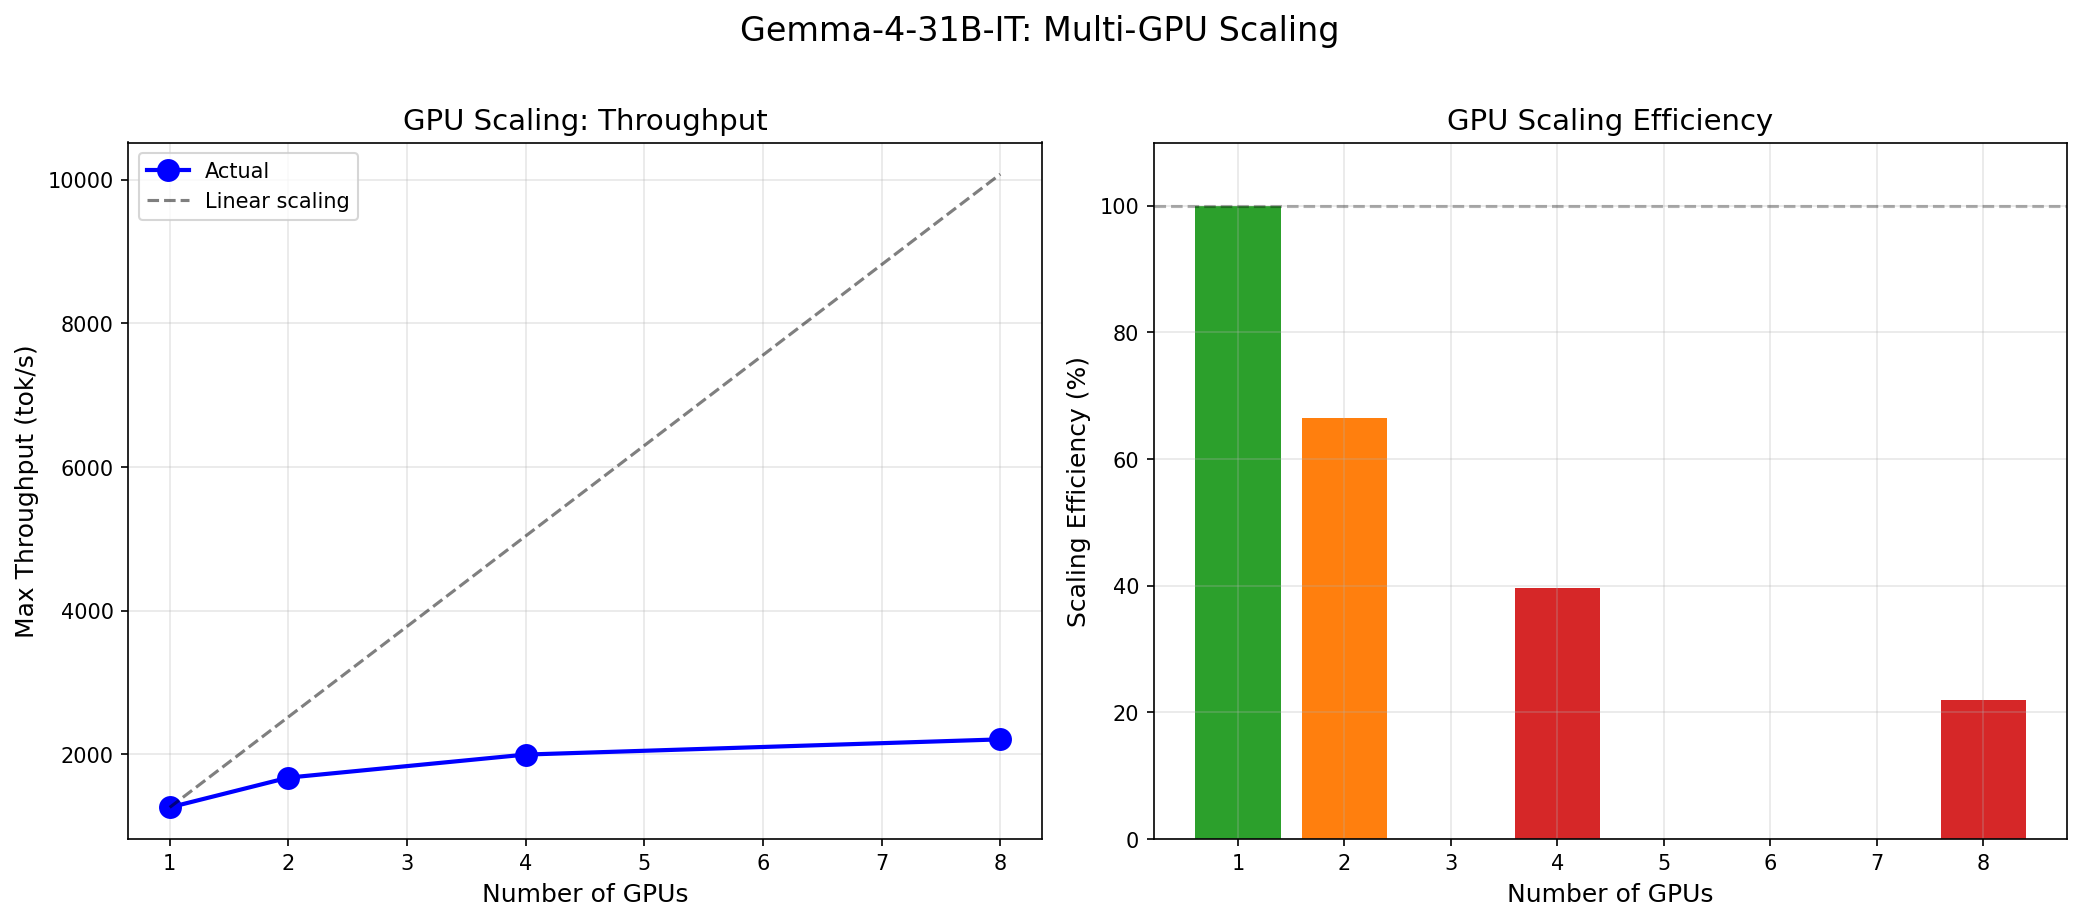
This echoes what we found in our Gemma 4 vs MoE analysis: architecture efficiency matters more than raw scale. Dense models can outperform MoE models with 4x more parameters when the dense model is well-optimized. And within the MoE family, expert quality matters more than expert quantity.
The implication for MoE researchers: the routing mechanism, training data quality per expert, and expert specialization strategy are higher-leverage improvements than simply adding more experts. Scaling the expert count is the easy lever. Making each expert genuinely specialized is the hard one.
Conclusion
M2.5 is the pragmatic choice for most workloads. It delivers equivalent throughput at production concurrency, marginally better quality, perfect long-context recall, and strong tool-use capability at 87%. It is the smaller, simpler, equally powerful option for batch processing, RAG pipelines, and general-purpose inference.
M2.7 is a specialist for tool-use-heavy agentic workloads. Its 93% tool-use accuracy, perfect complex-pipeline handling, and 100% ambiguous-scenario resolution make it the right choice when your system lives or dies by function calling reliability. The 11% throughput gain at peak concurrency is a bonus if you can consistently saturate it.
Neither model is a quality champion by MT-Bench standards. Neither follows instructions reliably. Both require 8 GPUs and $20/hour. The difference between them is narrower than the marketing copy would suggest.
The honest takeaway: doubling MoE parameters does not double capability. It barely moves the needle on most metrics, and actively hurts the one metric (reasoning) where either model showed promise. If you are evaluating these models, test them on your workload. The benchmark data says M2.5 is the safe bet and M2.7 is the agentic specialist. The benchmark data also says neither model will impress you on conversational quality. Plan accordingly.
Compare both models against the full GPU ecosystem at inferencebench.io/calculator.
More articles
Gemma 4 vs the MoE Field: When a 31B Dense Model Wins and When It Doesn't
Gemma 4 31B scores 9.73/10 MT-Bench from 31B dense params. We compare it against Mixtral 8x22B and DeepSeek V3 on cost, latency, and quality tradeoffs.
MiniMax M2.5: A 229B MoE Model That Defies Easy Judgment
MiniMax M2.5 229B MoE benchmarked on 8x H100: 8,876 tok/s peak, 100% needle-in-haystack, 87% tool use, but 1.57/10 MT-Bench. The full contradictory picture.
MiniMax M2.7: The Bigger MoE Paradox
MiniMax M2.7 456B MoE on 8x H100: 9,854 tok/s peak, 93% tool use, but MT-Bench dropped to 1.30. Bigger is not always better.