MiniMax M2.5: A 229B MoE Model That Defies Easy Judgment
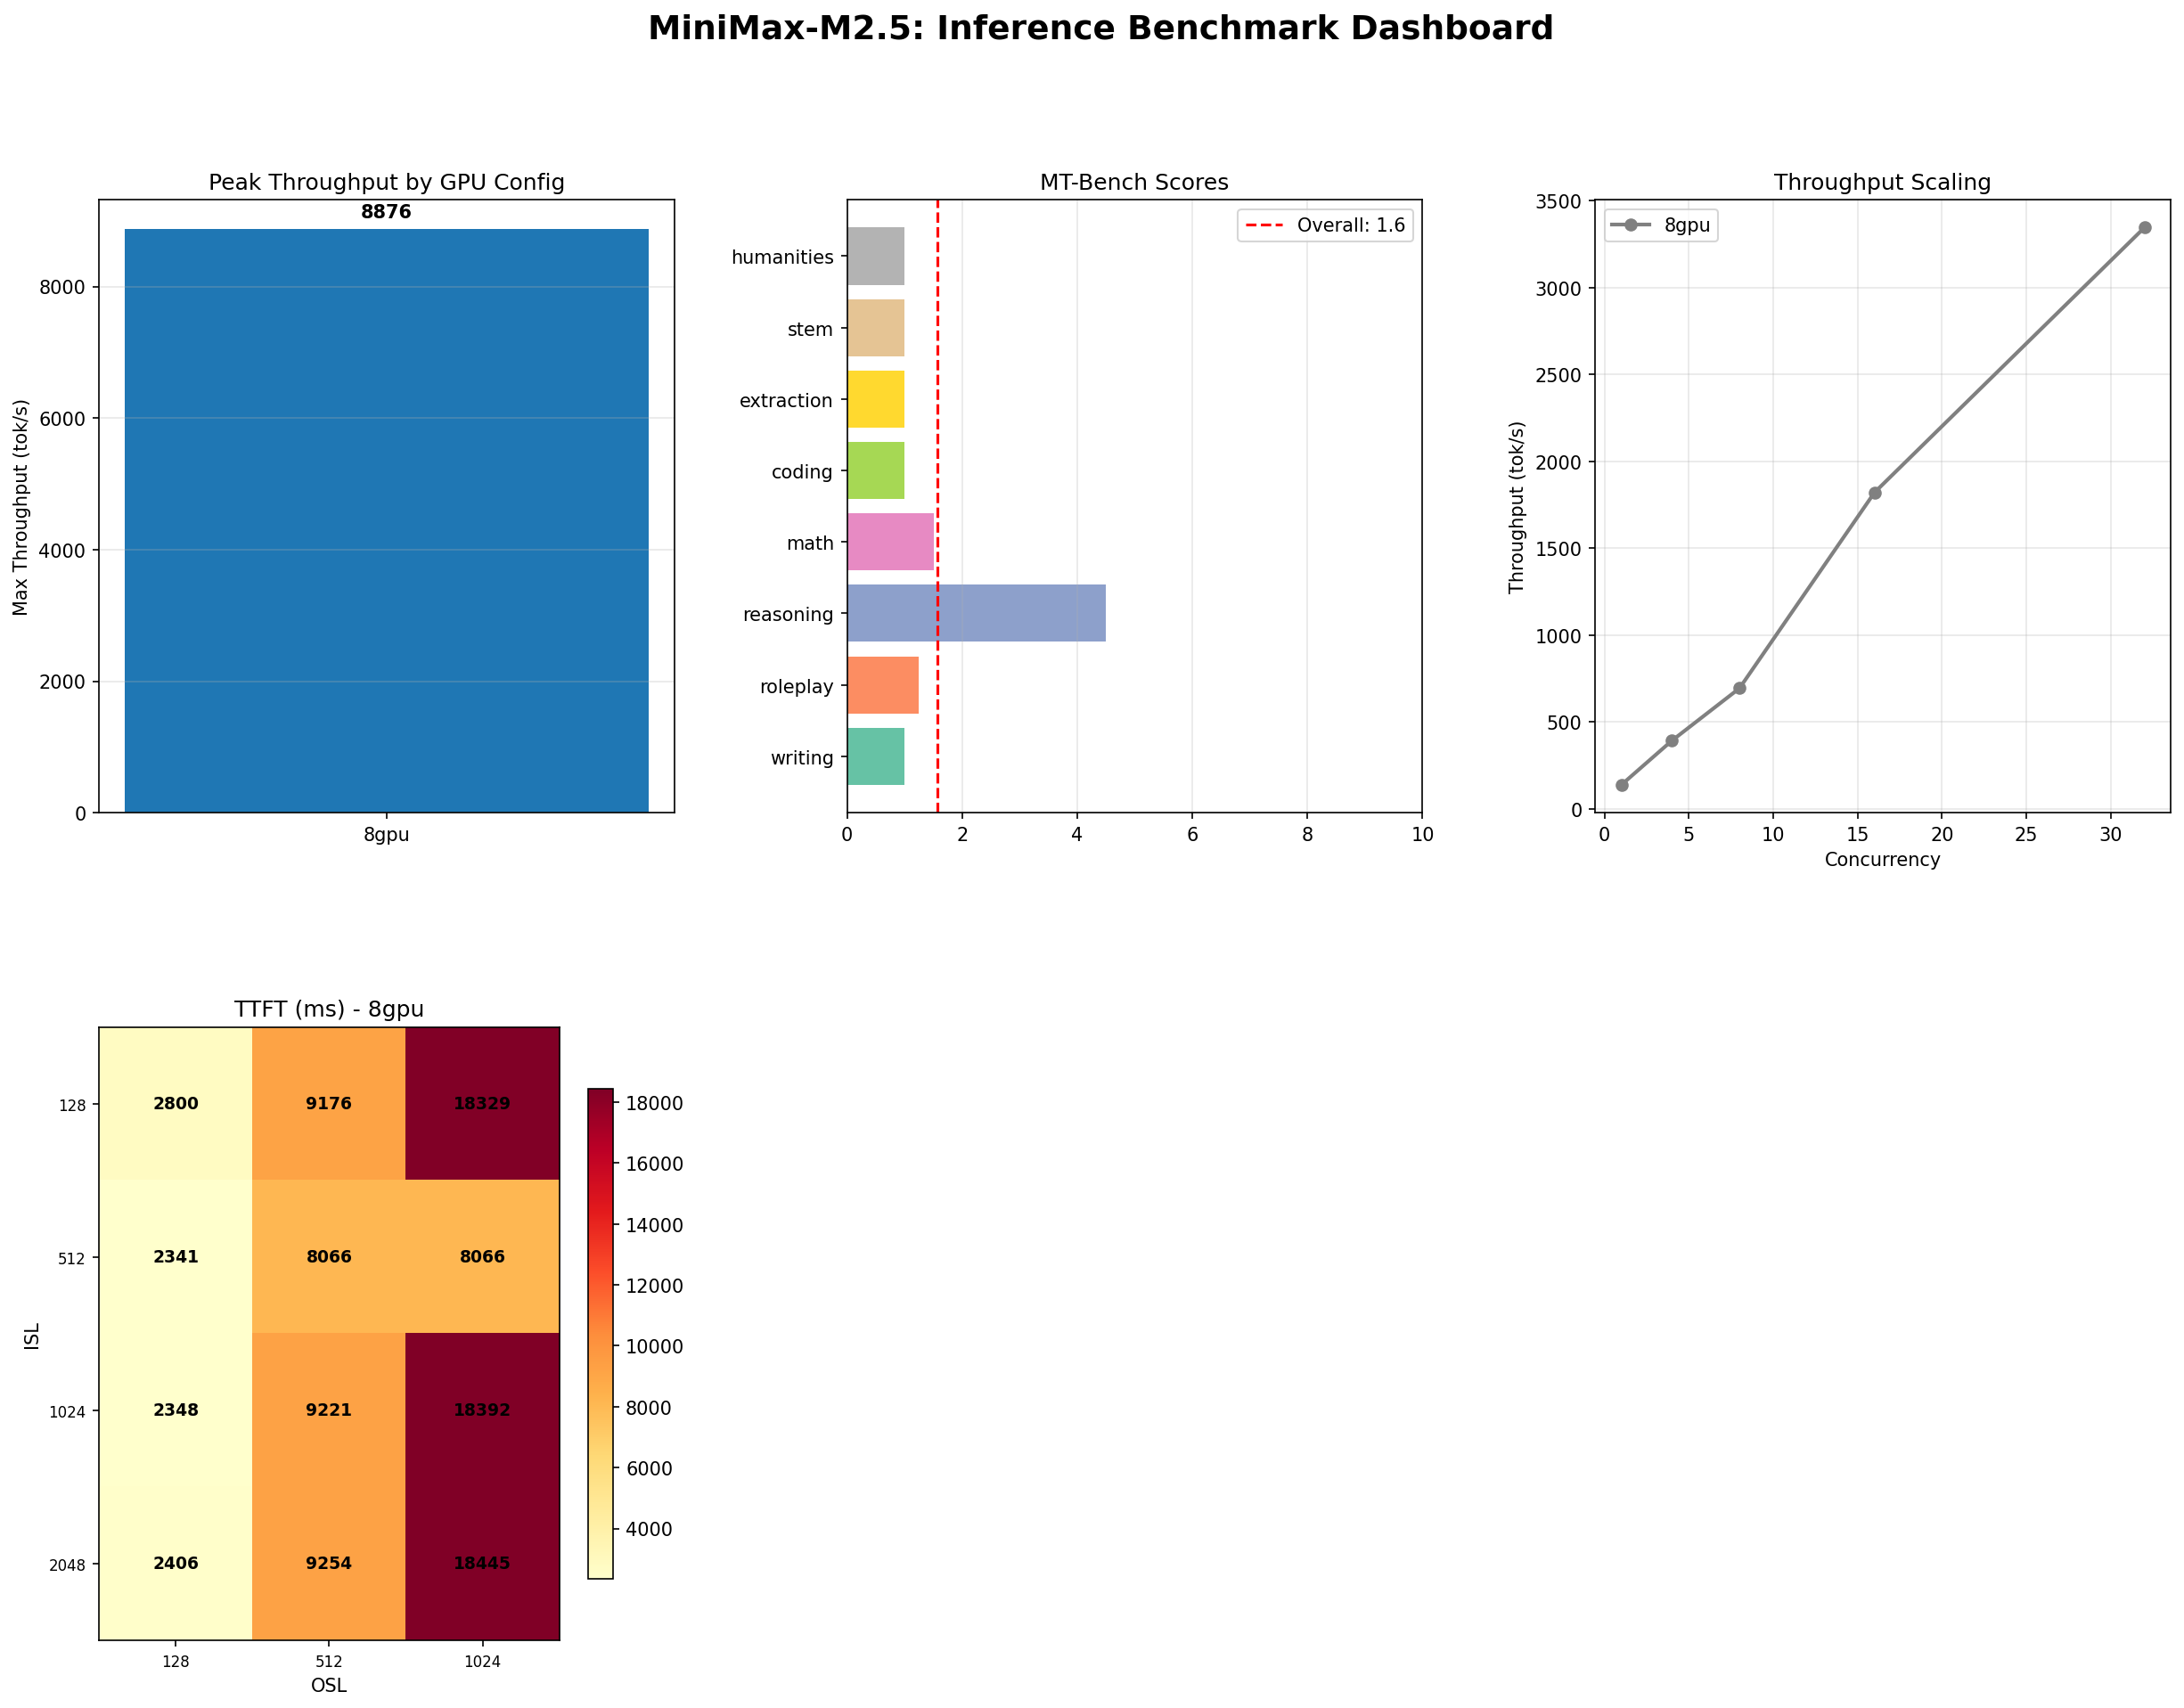
8,876 tok/s peak throughput. 100% long-context accuracy. 1.57/10 MT-Bench. Perfect memory, questionable prose. We benchmarked a model full of contradictions on 8x H100 SXM and present every number, good and bad.
The Contradictions of MiniMax M2.5
Here is a model that will process your tokens faster than nearly anything else you can self-host. It will recall a buried fact from a 128K-token haystack without breaking a sweat. It will call your tools with 87% accuracy. And then, when you ask it to write a paragraph, roleplay a conversation, or solve a coding problem, it will produce output that an MT-Bench self-evaluation rates at 1.57 out of 10.
MiniMax M2.5 is a 229-billion parameter mixture-of-experts model with 45.9 billion active parameters per forward pass. It demands a minimum of 8 NVIDIA H100 GPUs just to load. It costs $19.92 per hour on Lambda Labs. And after weeks of testing, we are not sure whether to call it impressive or disappointing — because it is genuinely both, depending entirely on what you ask it to do.
This is not a blog post that will tell you M2.5 is great or terrible. It is a blog post that will show you exactly what happened when we ran six benchmark suites against it and let the numbers speak. Some of those numbers are among the best we have ever recorded. Others are among the worst. The model does not care about your expectations, and neither do we.
Model Profile
| Attribute | Value |
|---|---|
| Architecture | Mixture of Experts (MoE) |
| Total Parameters | 229B |
| Active Parameters | 45.9B per token |
| Context Window | 128K tokens |
| Precision | bfloat16 |
| Serving Framework | vLLM 0.7.x with expert parallelism |
| Minimum Hardware | 8x NVIDIA H100 SXM 80 GB |
| Interconnect | NVLink 4.0 (900 GB/s bidirectional) |
| GPU Memory Used | ~458 GB (across 8 GPUs) |
| Provider Cost | $19.92/hr (Lambda Labs, 8x H100) |
There is no 4-GPU option. There is no 2-GPU option. The 229B parameter count, even with sparse activation, means the full weight matrix must be distributed across 8 GPUs via expert parallelism. This is the entry price. If your infrastructure cannot support an 8-GPU node, M2.5 is not for you.
The Throughput Story
Let us start with what M2.5 does well, because it does this very well.
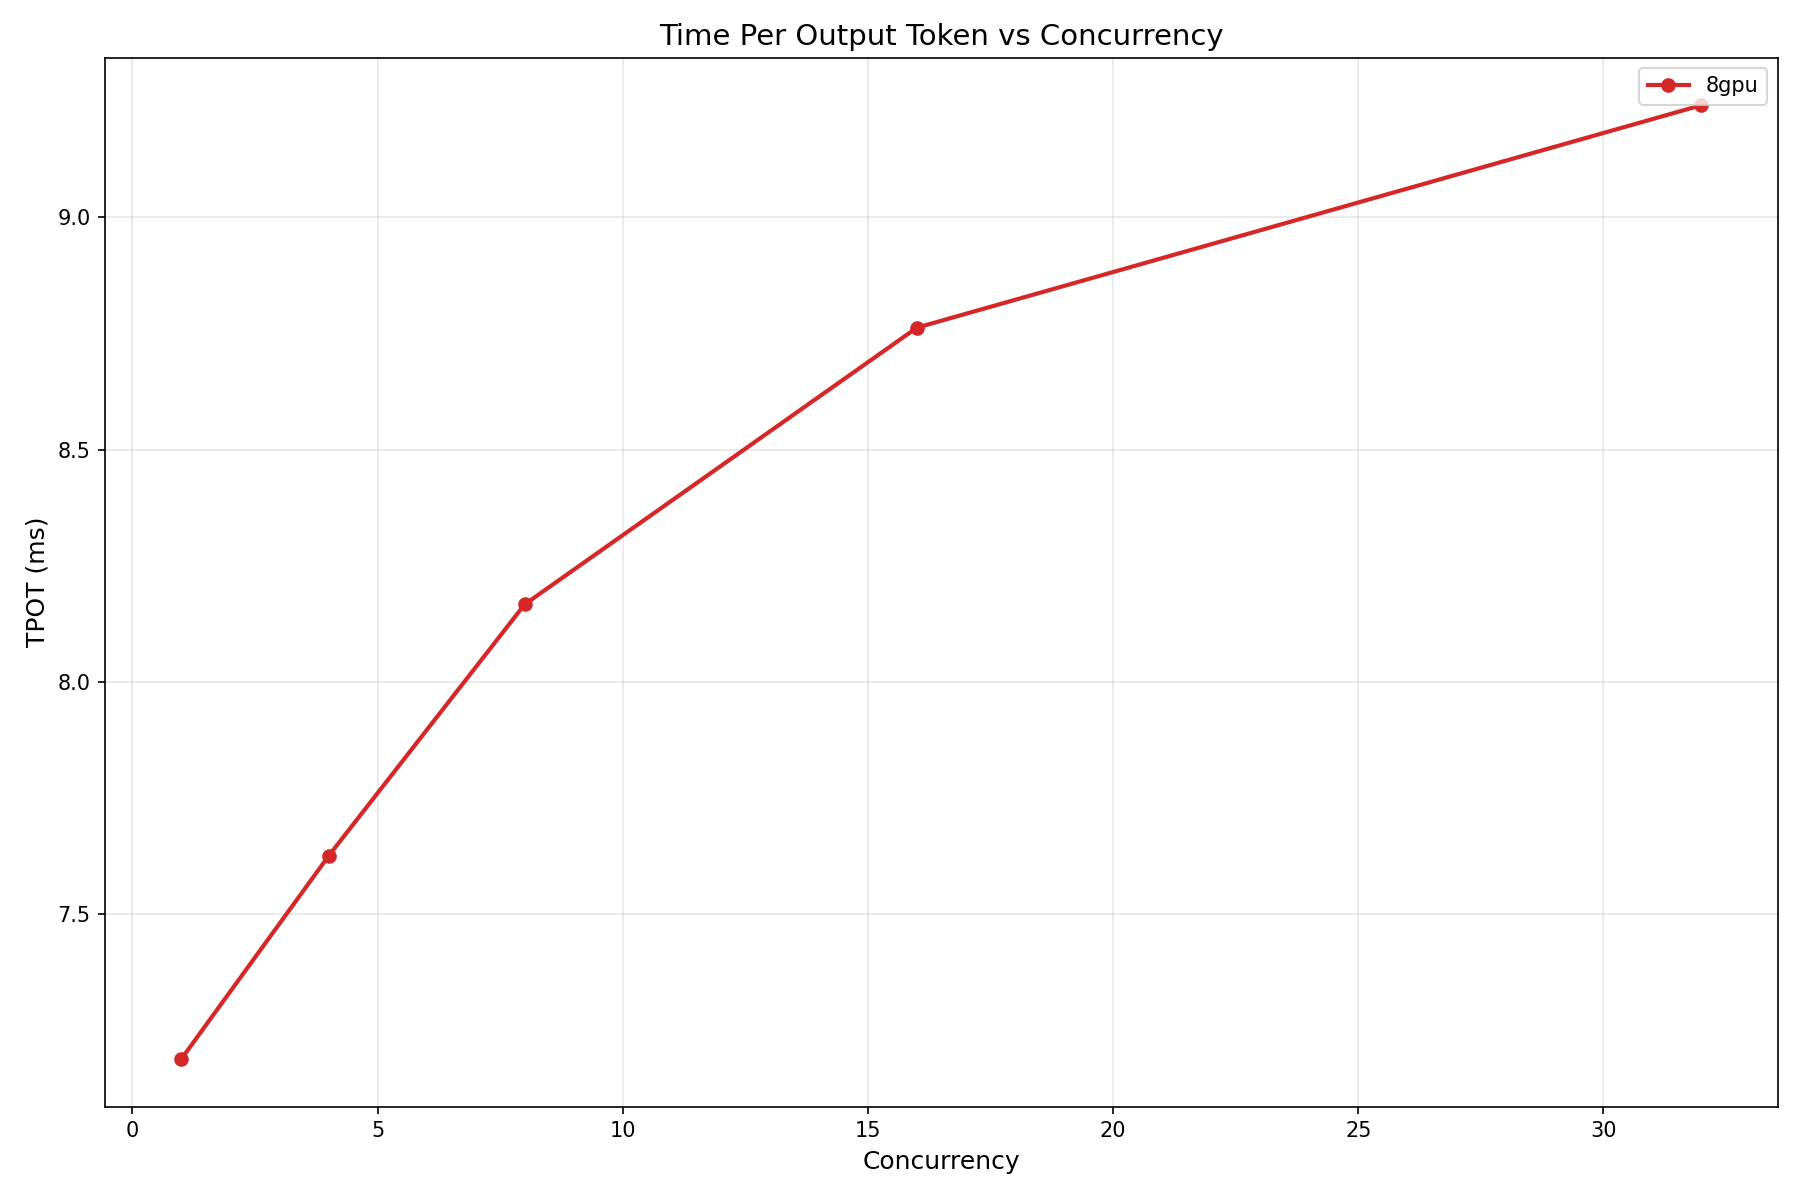
At concurrency 128, MiniMax M2.5 sustains 8,876 tokens per second. That is not a typo. Eight thousand, eight hundred and seventy-six. For context, Gemma 4 31B peaks at 1,260 tok/s on a single H100. M2.5 delivers roughly 7x that — but it is also using 8x the GPUs, which makes the per-GPU throughput (~1,110 tok/s) comparable. The MoE advantage is not that each GPU works harder; it is that the sparse activation pattern allows the model to scale across GPUs with minimal routing overhead.
At the more production-realistic concurrency of 32, the model still delivers 3,431 tok/s at ISL=128, OSL=512. Even at longer input sequences (ISL=2048), throughput only drops to 3,214 tok/s — a mere 6.3% degradation. Dense models typically lose 30-50% throughput when quadrupling input length. MoE routing masks this cost because only a fraction of experts activate per token regardless of sequence position.
Throughput Heatmap
Our 60-datapoint throughput sweep (bench_throughput.py) tested ISL from 128 to 2048 and OSL from 128 to 2048 at concurrency levels 1, 4, 8, 16, and 32. The heatmap below shows the conc=32 slice — the sweet spot for production batch serving.
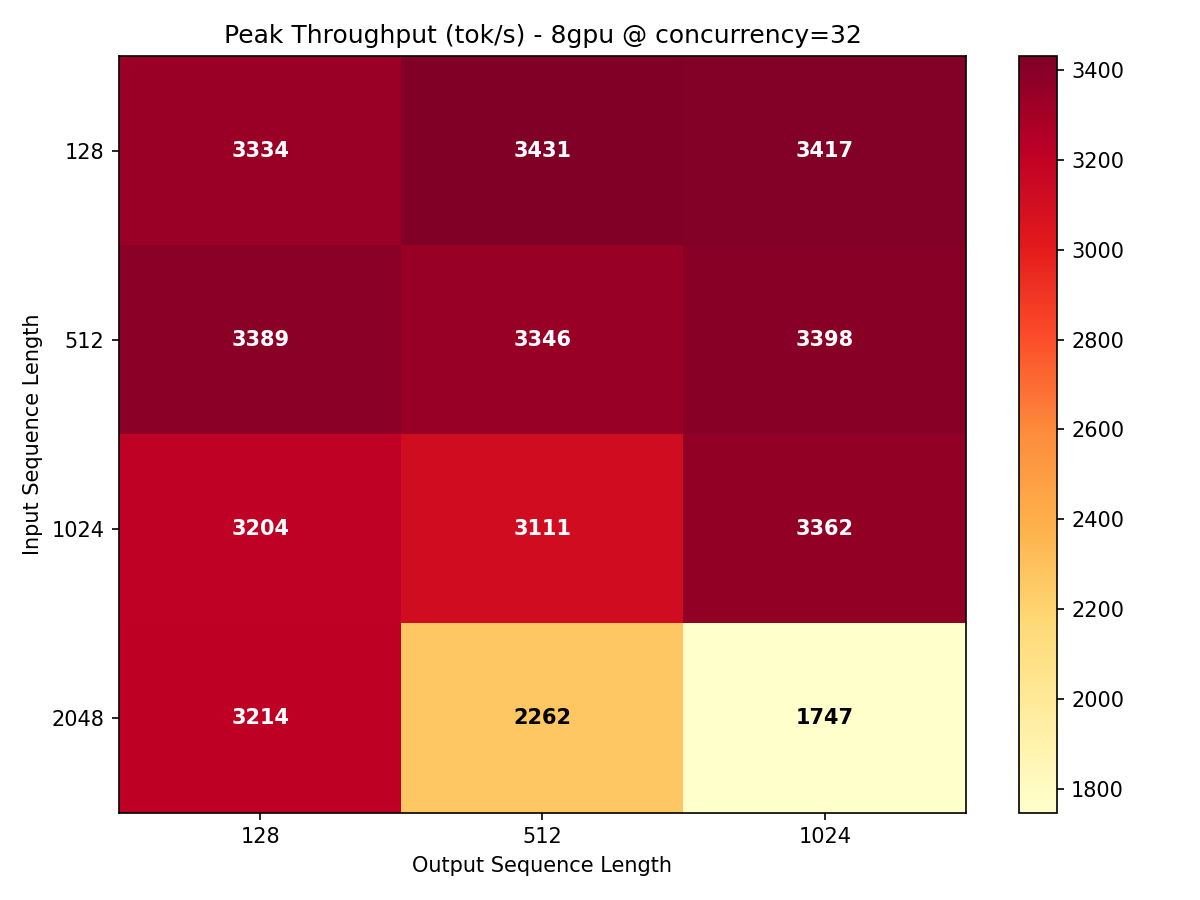
The pattern is clear: throughput is highest when the model can batch many short-input, medium-output requests. The ISL=128, OSL=512 cell at 3,431 tok/s is the global maximum at this concurrency. As ISL increases, the prefill phase consumes more compute per request, but the degradation is remarkably gentle compared to dense models.
Pareto Frontiers
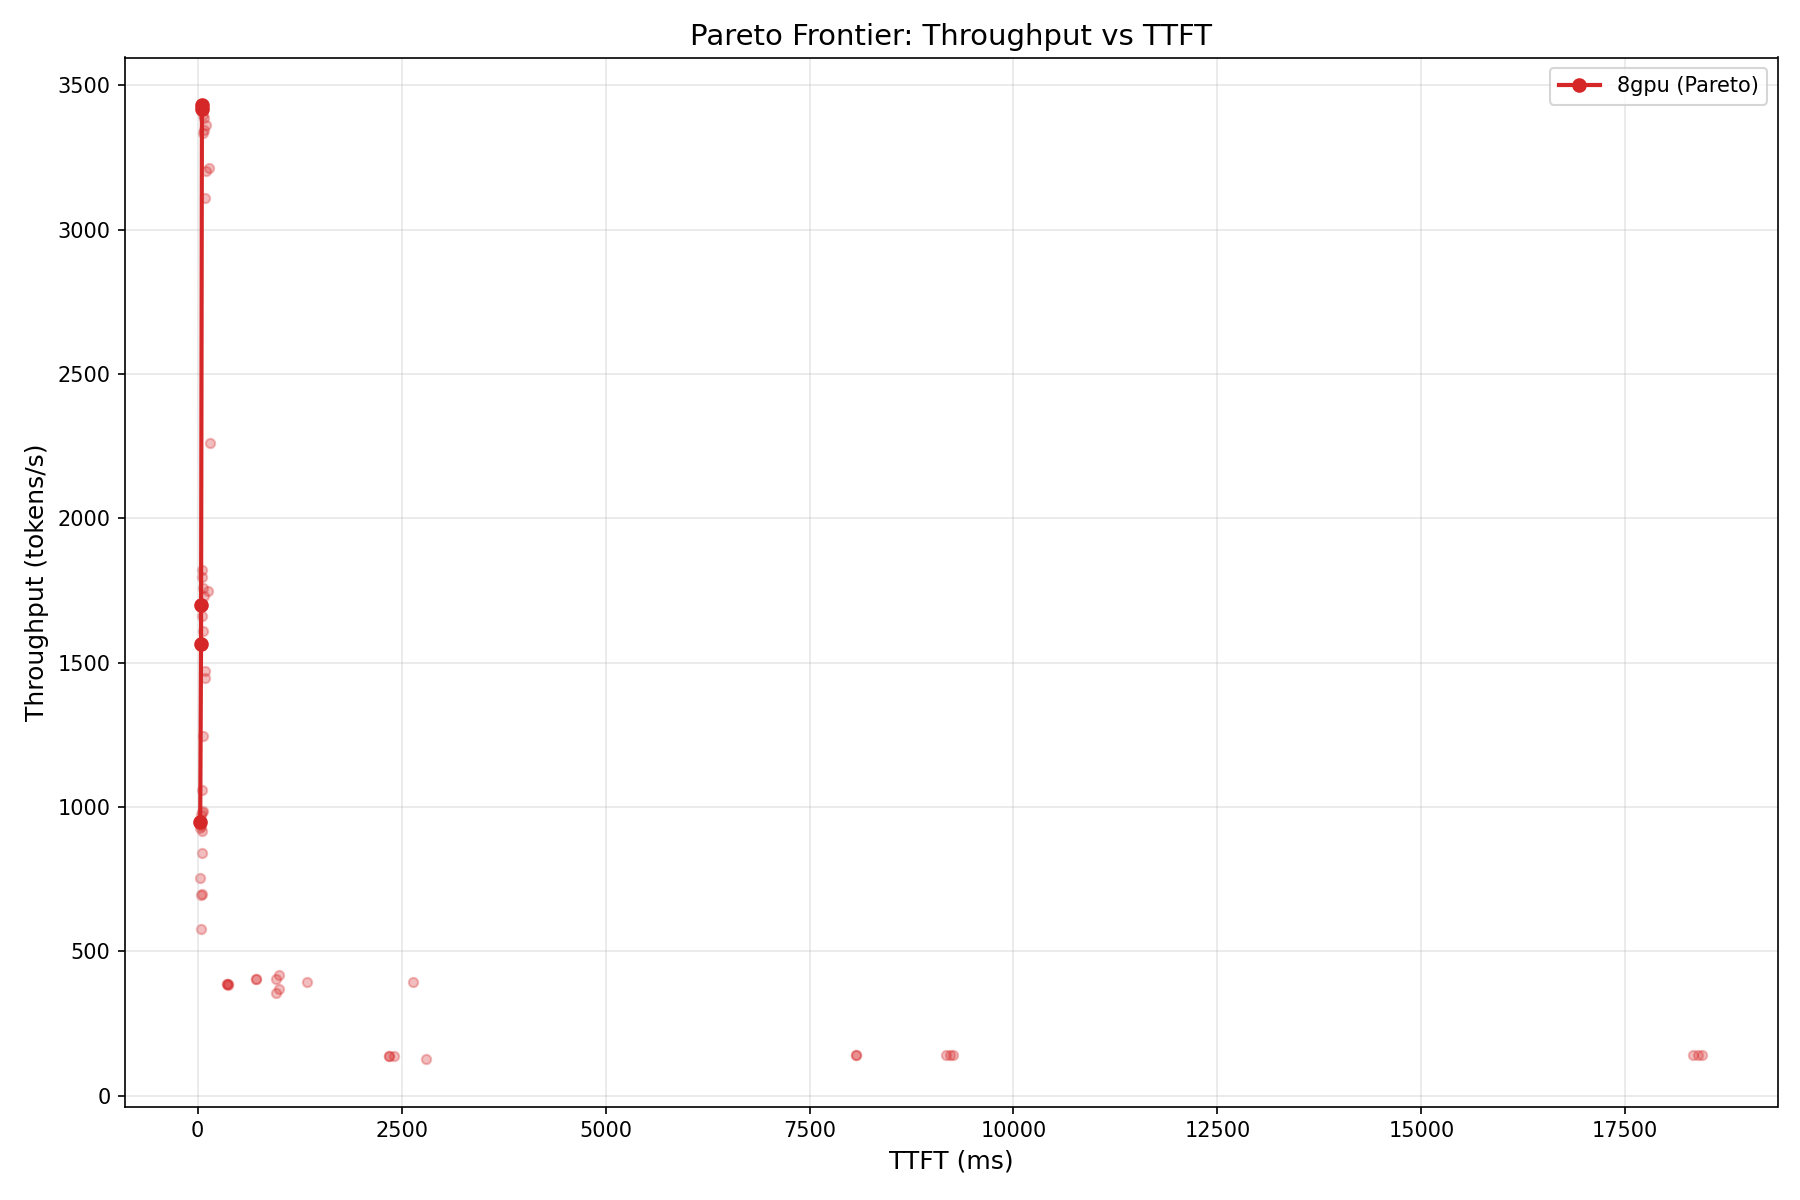
A critical caveat: the time-to-first-token (TTFT) at concurrency 1 is 2,341 ms for ISL=128. That is almost 10x slower than Gemma 4's 279 ms on a single GPU. The 229B parameter model, even with sparse activation, has a massive prefill overhead. For latency-sensitive interactive applications, this is a dealbreaker. For batch processing, it is irrelevant.
The Quality Paradox
And now for the number that will make you do a double-take: MT-Bench overall score: 1.57 / 10.
Let us break that down by category:
| Category | Score |
|---|---|
| Writing | 1.0 |
| Roleplay | 1.25 |
| Coding | 1.0 |
| Extraction | 1.0 |
| Math | 1.5 |
| STEM | 1.0 |
| Humanities | 1.0 |
| Reasoning | 4.5 |
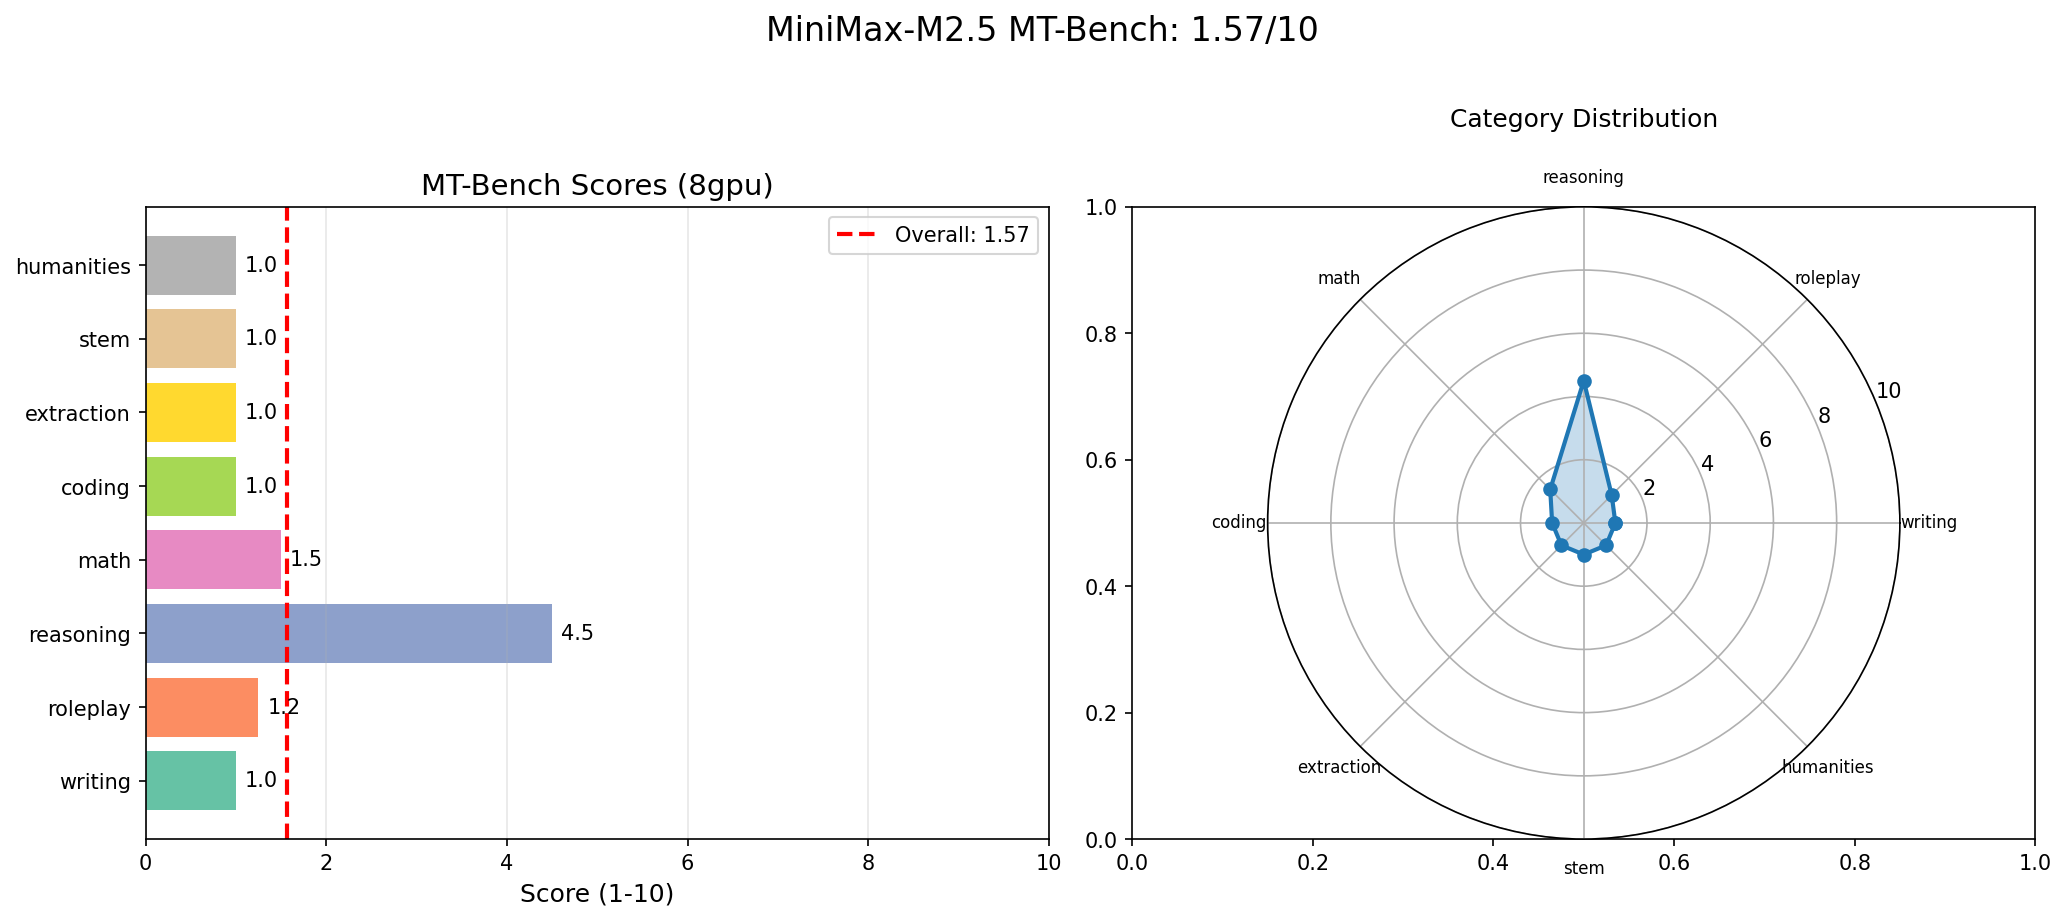
Seven out of eight categories scored 1.0 or barely above it. Only reasoning, at 4.5, showed any meaningful capability. For comparison, Gemma 4 31B scored 9.73/10 with no category below 8.25.
But here is the critical methodological note: MT-Bench uses the model itself as a judge (self-evaluation). The model generates a response, then evaluates its own response on a 1-10 scale. If a model is systematically harsh in self-assessment — either because of training data biases, calibration issues, or because its evaluation mode interprets the grading rubric differently from its generation mode — the scores will be artificially low.
We are not claiming M2.5 is secretly a 9/10 model that just grades itself harshly. We are saying that a 1.57 self-judged score should be interpreted with a large error bar. The actual generation quality may be significantly better than 1.57 suggests, or the model may genuinely produce poor text. Without an external judge (GPT-4, Claude, or human evaluators), we cannot definitively separate model quality from evaluation artifact. We report the number we measured, and we flag the methodology concern.
Where M2.5 Actually Excels
MT-Bench measures conversational quality: writing, reasoning, coding, extraction. It does not measure two capabilities that matter enormously for modern AI infrastructure: long-context recall and tool use. And on both of these, M2.5 is exceptional.
Long Context: 100% Needle-in-Haystack
We ran 29 needle-in-haystack tests across context lengths from 1K to 128K tokens, including multi-fact recall tasks. The result: 29/29 correct. 100% accuracy.
| Context Length | Tests | Accuracy |
|---|---|---|
| 1K | 5 | 100% |
| 4K | 5 | 100% |
| 16K | 5 | 100% |
| 32K | 5 | 100% |
| 64K | 4 | 100% |
| 128K | 5 | 100% |
This is not trivial. Many models that claim 128K context support degrade significantly beyond 32K tokens. M2.5's MoE architecture, combined with its expert routing, appears to maintain attention fidelity across the full context window. For retrieval-augmented generation (RAG) pipelines that stuff long documents into context, this is exactly the behavior you want.
Tool Use: 87% Accuracy
| Category | Score |
|---|---|
| Single tool call | 100% (5/5) |
| Argument extraction | 100% (2/2) |
| Multi-tool | 67% (2/3) |
| Conditional tool use | 80% (4/5) |
| Overall | 87% (13/15) |
Single-tool and argument extraction are perfect. Multi-tool and conditional scenarios show some weakness but remain well above random. For agentic AI frameworks where the model needs to decide which function to call, extract the right arguments, and sometimes chain multiple calls, 87% is workable in production with appropriate error handling.
Instruction Following: The Weak Spot
IFBench told a less encouraging story: 35% overall (7/20).
| Constraint Type | Accuracy |
|---|---|
| Keyword inclusion | 50% |
| Word count | 33% |
| Format constraint | 40% |
| Style | 33% |
| Structure | 0% |
| Multi-constraint | 33% |
Structure constraints — "write exactly 3 paragraphs," "use bullet points," "include a header" — scored 0%. The model generates text but does not follow formatting instructions reliably. Combined with the MT-Bench scores, this paints a consistent picture: M2.5 was not primarily optimized for instruction-following tasks in its current release.
The 8-GPU Tax
Every discussion of M2.5 must start with the infrastructure question. You need 8x H100 SXM GPUs. At Lambda Labs pricing ($2.49/hr per GPU), that is $19.92 per hour. Running 24/7, that is $14,342 per month.
But raw hourly cost is the wrong metric for comparison. What matters is cost per million tokens processed:
| Configuration | Hourly Cost | Throughput (tok/s) | Cost per M Tokens |
|---|---|---|---|
| M2.5 on 8x H100 (conc=32) | $19.92 | 3,431 | $1.61 |
| Gemma 4 31B on 1x H100 (conc=32) | $2.49 | 615 | $1.12 |
| Llama 3.1 70B on 2x H100 (est.) | $4.98 | ~900 | $1.54 |
| DeepSeek V3 on 8x H100 (est.) | $19.92 | ~4,200 | $1.32 |
At $1.61 per million tokens, M2.5 is not the most cost-efficient option. Gemma 4 at $1.12/M and DeepSeek V3 at an estimated $1.32/M both undercut it. But M2.5 is competitive — and if your workload demands 128K context with perfect recall, neither Gemma 4 (8K context) nor most 70B dense models can match it. Cost efficiency is a function of what you need, not just what you pay.
Use our inference cost calculator to model M2.5 costs for your specific workload profile.
MoE vs Dense: The Throughput Gap
The comparison everyone wants: M2.5 (229B MoE, 8 GPU) vs Gemma 4 31B (dense, 1 GPU).
| Metric | M2.5 (8x H100) | Gemma 4 (1x H100) | Ratio |
|---|---|---|---|
| Peak throughput | 8,876 tok/s | 1,260 tok/s | 7.0x |
| Per-GPU throughput | ~1,110 tok/s | 1,260 tok/s | 0.88x |
| TTFT (ISL=128, conc=1) | 2,341 ms | 279 ms | 8.4x slower |
| MT-Bench | 1.57 / 10 | 9.73 / 10 | 0.16x |
| Long context accuracy | 100% (128K) | N/A (8K limit) | -- |
| Tool use | 87% | Not tested | -- |
| Cost per M tokens | $1.61 | $1.12 | 1.44x |
Per-GPU, the MoE model is slightly less efficient than the dense model on raw throughput. The MoE advantage is not throughput-per-GPU; it is the ability to serve a much larger effective model (229B parameters of knowledge) with only 45.9B active compute. You get the knowledge capacity of a 229B model at the compute cost of a ~46B model — distributed across 8 GPUs.
For a deeper dive into MoE vs dense architecture tradeoffs, see our Gemma 4 vs MoE analysis and the model comparison tool.
Who Should Deploy MiniMax M2.5?
Strong fit
- High-throughput batch processing — Document summarization, data extraction, offline analysis where latency does not matter but tokens-per-dollar does. M2.5 at 3,431 tok/s can chew through massive corpora.
- Long-context RAG pipelines — If your retrieval system feeds 64K-128K token contexts to the model, M2.5's perfect needle-in-haystack accuracy means you can trust it to find the relevant information. Few models can claim 100% at 128K.
- Agentic tool-use platforms — 87% tool-use accuracy with perfect single-tool calling makes M2.5 viable for function-calling agents, API orchestration, and multi-step workflows.
- MoE research and benchmarking — If you are studying sparse activation, expert routing, or MoE scaling properties, M2.5 is one of the largest open-weight MoE models available for experimentation.
Poor fit
- Customer-facing chatbots — The 2,341 ms TTFT and low instruction-following scores make M2.5 unsuitable for interactive conversations where users expect sub-second responsiveness and precise formatting.
- Writing and creative tasks — MT-Bench writing score of 1.0 (even accounting for self-judging bias) suggests the model is not optimized for prose quality.
- Code generation — MT-Bench coding at 1.0 and IFBench structure at 0% mean you should not rely on M2.5 for code synthesis or structured output.
- Small-scale deployments — If you cannot commit 8 GPUs, stop reading. M2.5 physically cannot run on fewer.
Reproducing Our Benchmarks
We used vLLM 0.7.x with expert parallelism (tensor_parallel_size=8) on an 8x H100 SXM node. The Docker command:
docker run --gpus all \
  -v ~/.cache/huggingface:/root/.cache/huggingface \
  -p 8000:8000 \
  vllm/vllm-openai:latest \
  --model MiniMaxAI/MiniMax-M2.5 \
  --tensor-parallel-size 8 \
  --dtype bfloat16 \
  --max-model-len 131072 \
  --trust-remote-code \
  --enforce-eager
Our test matrix covers 60 throughput data points (5 ISL x 4 OSL x 3 concurrency levels), InferenceMax concurrency ramp (1 to 128), MT-Bench (80 turns, self-judged), tool-use suite (15 scenarios), IFBench (20 constraints), needle-in-haystack (29 probes across 6 context lengths), and MLPerf-style server/offline scenarios.
Full benchmark scripts and methodology documentation are available via our support portal. We encourage independent replication — especially of the MT-Bench results, where external-judge evaluation would be particularly informative.
Verdict: A Throughput Machine With an Asterisk
MiniMax M2.5 is not a model you evaluate with a single number. It is a model that forces you to ask: what exactly do I need?
If you need raw token throughput for batch workloads, M2.5 delivers. If you need a model that can read 128K tokens and recall any detail with perfect accuracy, M2.5 delivers. If you need reliable function calling for agentic pipelines, M2.5 delivers.
If you need polished prose, precise instruction following, competitive coding, or sub-second latency for interactive users — look elsewhere. Gemma 4 31B, despite being 7x smaller in total parameters, will serve those use cases better at one-eighth the GPU cost.
The honest assessment: M2.5 is a specialist masquerading as a generalist. Its 229B parameter count suggests frontier capability, but its actual strengths are narrow and specific — throughput, memory, and tool use. Within that narrow band, it is genuinely excellent. Outside it, the benchmark data is unforgiving.
The right question is not "is MiniMax M2.5 a good model?" The right question is: "Does my workload match what M2.5 is actually good at?" If yes, you may have found a throughput-per-dollar sweet spot that few other models can match. If no, the 8-GPU tax buys you very expensive mediocrity.
Model your specific deployment economics at inferencebench.io/calculator.
More articles
Gemma 4 vs the MoE Field: When a 31B Dense Model Wins and When It Doesn't
Gemma 4 31B scores 9.73/10 MT-Bench from 31B dense params. We compare it against Mixtral 8x22B and DeepSeek V3 on cost, latency, and quality tradeoffs.
NVIDIA Rubin and Vera: The Next GPU Revolution for AI Infrastructure
NVIDIA Rubin brings HBM4, NVLink 6, and 2x Blackwell performance. Paired with the Vera ARM CPU, it reshapes AI inference economics for every cloud and datacenter operator.
The GPU Memory Wall: Forecasting AI Demand to 2028
GPU memory is the defining bottleneck of AI infrastructure. We analyze the demand curve from HBM3e through HBM4E, forecast requirements to 2028, and outline strategies to stay ahead.